Search
Sign In
Auto
2:3
Auto
2:3
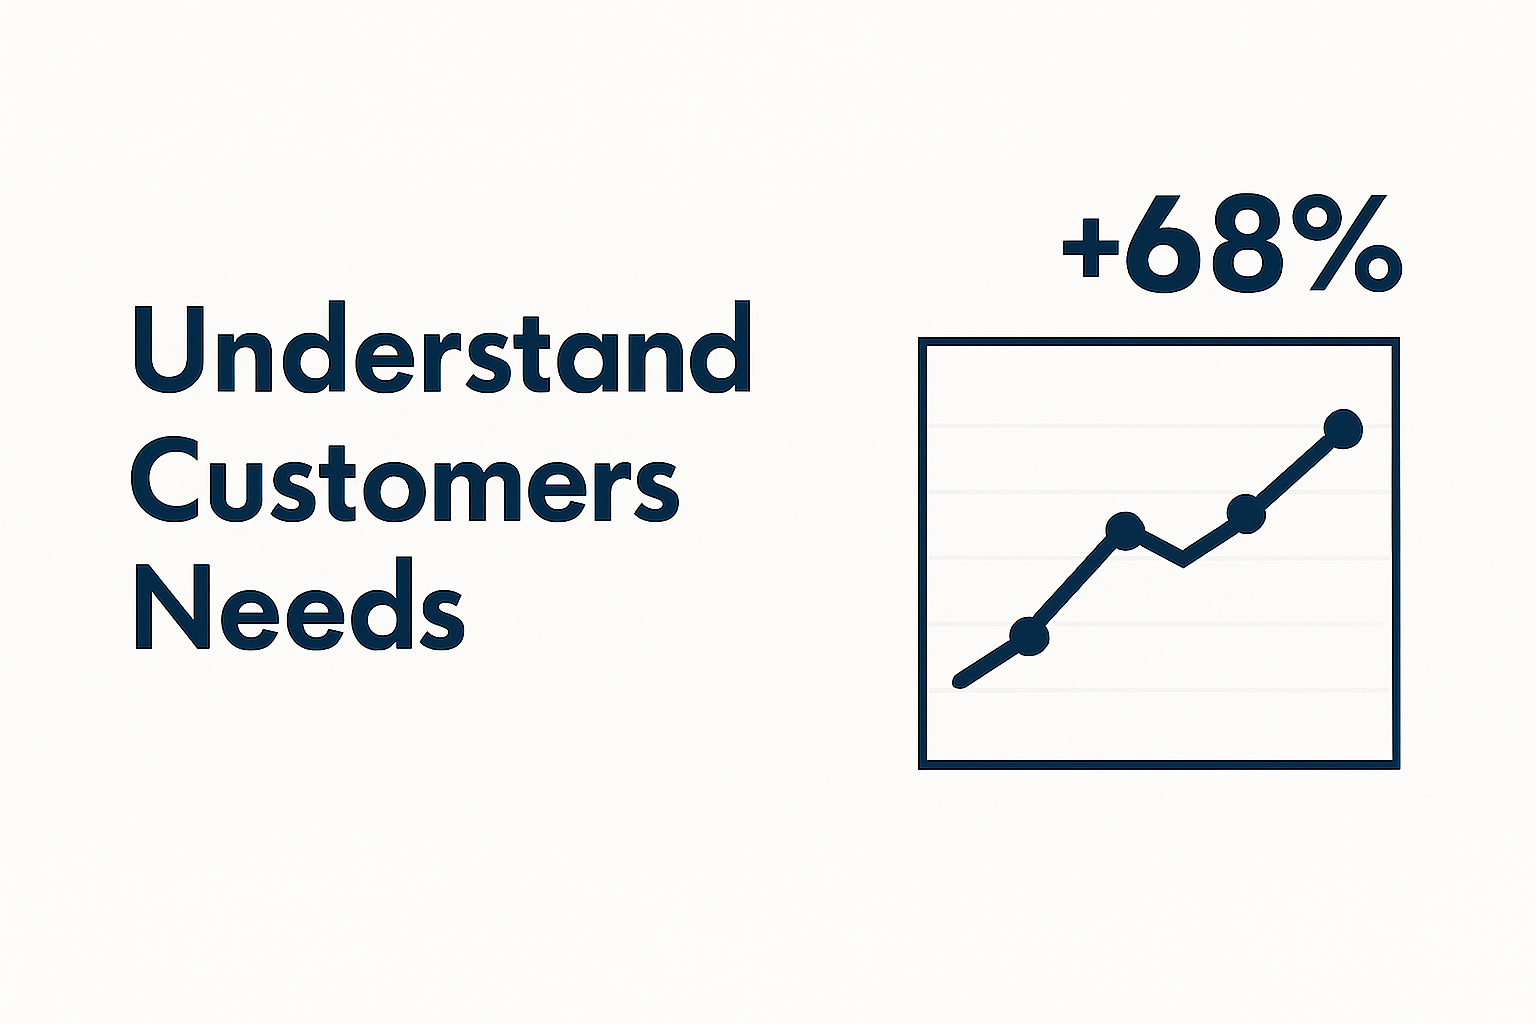
Graphical Representation of Customer Needs Growth
/
Free
/
Collection:
Base
/
by davooda
/
Type: PNG
/
Informative infographic illustrating a significant increase in understanding customer needs, featuring a line graph and bold typography suitable for business presentations.
Graphical Representation of Performance Metrics with Bold Typography
Stylized 3D Bar Graph Showing Growth Trend
Email Marketing Performance Infographic Highlighting Key Metrics
Business Professional Analyzing Graphs and Charts
Stylized Financial Growth Chart with Dollar Coin
Infographic Highlighting Key Performance Indicators (KPIs)
Modern Graph Icon Illustrating Growth and Progress
Minimalist Analytics Illustration with Graphs and Data
Positive Growth Indicator with Thumbs Up Symbol
Futuristic Digital Handshake Illustration for Collaboration Themes
Performance Gauge Icon with Bold Typography
Stylized Graph Showing Financial Growth with Dollar Coin
Case Study Results Visual with Graphs and Statistics
Growth Chart with Rising Arrow Illustration
Data Analytics Illustration with Graphs and Percentages
Performance Gauge Graphic with Bold Typography
Infographic Illustrating the Customer Journey Stages
Dynamic Financial Chart with Rising Trends and Urban Background
Futuristic Digital Handshake Illustrating Partnership
Digital Handshake Symbolizing Partnership and Collaboration
Performance Gauge Graphic Indicating Metrics
Healthcare Growth Chart with Medical Elements
Customer Feedback Illustration with Smartphone and Reviews
Digital Handshake Symbolizing Partnership and Collaboration
3D Laptop with Rising Graph and Charts on Purple Background
Handshake Icon Representing Agreement and Friendship
Performance Meter Graphic with Bold Typography
Vibrant Blue Background for Design Projects
Performance Gauge Graphic with Indicator
Minimalist Icon Graphic with Heart and Paper Plane
Infographic Displaying KPI Progress Metrics with Visual Elements
Case Study Results Highlighting Key Metrics
Customer Testimonials Graphic Featuring Ratings
Performance Meter Graphic Indicating Efficiency Level
Friendly AI Robot with Headset Illustrating Customer Support
Minimalist E-commerce Illustration with Shopping Cart
Performance Metrics Infographic with Key Indicators
Illustration of Interlocking Gears in Different Sizes
Infographic Highlighting Case Study Results with Graphical Elements
Dynamic Business Meeting with Team Collaboration and Strategy Planning
Performance Gauge Icon with Red and White Color Scheme
Abstract Blue Light Trails on Dark Background
Illustrative Diagram of Customer Feedback Loop Process
Performance Indicator Graphic with Gauge and Thumbs Up
Colorful Infographic Illustrating Business Performance Metrics
Customer Testimonial Graphic with Star Ratings
Abstract Technology Background with Network Connections
Performance Gauge Icon with Minimalistic Design
Market Research Infographic Summary with Key Insights
Customer Testimonials Graphic with Star Ratings
Performance Growth Chart with Positive Feedback Symbol
Customer Testimonial Graphic with Star Ratings
Stylish Blue Background with Geometric Shapes and Icons
Professional Accountant Analyzing Data with Laptop and Calculator
Customer Review Illustration on Smartphone
Customer Feedback Illustration with Star Ratings
Abstract Digital Network Visualization with Blue Connections
Lock Symbol Representing Data Security and Flowing Information
Revenue Trend Graph Illustrating Audience Insights
KPI Comparison Graphic with Smartphone Illustrations
Diverse Hands Coming Together in Unity on a Blue Background
Illustration of User Interaction with Mobile App
Illustration of Interlocking Gears in Two Colors
Growth Chart Icons Representing Business Success
Friendly Robot Assistant with Headset on Blue Background
Data Visualization of User and Revenue Growth Metrics
Illustration of Customer Support Tools with Computer and Headset
Modern Data Visualization Graphics on Transparent Panels
E-Commerce Trends Infographic with Engaging Visual Elements
E-commerce Marketing Infographic with Key Concepts
Abstract Blue Digital Wave Background for Technology Designs
Business Strategy Infographic Highlighting Key Metrics and Actions
Infographic on Key Business Strategies and Metrics
Global Network Connections in Blue Glow
Performance Gauge Illustration with Clear Indicators
Thank You Graphic with Bold Typography and Thumbs Up
Infographic on Marketing Strategies with Visual Icons
Infographic Highlighting Key Statistics on Problem Understanding
Infographic on Customer Support Process Steps
Customer Testimonials Graphic Highlighting Satisfaction
Cheerful Character Celebrating Achievement with Trophy and Graph
Futuristic 3D Brain Illustration on Blue Background
Aerial View of Urban Highway Interchange at Night
Performance Meter Graphic with Thumbs Up Icon
Informative KPI Graphic for Business Metrics
Digital Global Connectivity Map with Network Lines
Stylized Lock Symbol Representing Data Security
Customer Feedback Social Media Graphic Featuring Positive Reviews
Informative Graphic on Marketing Strategies and KPIs
Illustrative Graphic on Growth Metrics and Financial Trends
Minimalist Loyalty Rewards Promotional Graphic
Dynamic Business Meeting with Team Collaboration on Strategy
Futuristic Digital Brain with Glowing Effects
Digital Shopping Cart on Smartphone Illustration
Abstract Digital Background with Light Rays and Particles
Bullseye Target with Arrow Hitting Center at Sunset
User Feedback Illustration Featuring Negative Reviews
Illustrative Graphic Representing Artificial Intelligence Concepts
Informative Graphic on Marketing Strategies and KPIs
Testimonial Social Media Post with User Feedback
Marketing Graphic Promoting Customer Growth Through Relationships
Graphical Representation of Rating Improvement Strategies
Market Growth Trends Visualization with Strategic Insights
Business Funding Progress Chart with Growth Analysis
Promotional Graphic for Customer Rating Improvement
Digital Transformation Growth Chart Graphic
Customer Satisfaction Promotion Graphic with Engaging Metrics
Customer Satisfaction Infographic with Diverse Employee Representation
KPI Infographic for Data Visualization and Analysis
Modern Data Analysis Graphic with Insights Theme
Professional Business Growth Strategies with Engaging Visuals
Professional Data Presentation and Evaluation Graphic
Financial Growth Infographic with Investment Insights
Modern Graphic Highlighting User Ratings with Bar Graph
Market Analysis Graphic with Data Visualization
Financial Growth Infographic Highlighting ROI
Professional Growth Achievement Graphic with Progress Bar
Modern Graphic for Enterprise Solutions with Customization Theme
Customer Satisfaction Transformation Graphic
Financial Investment Analysis Graphic with Trend Chart
Minimalistic Comparison Chart Graphic for Data Analysis
Launch Your Business Promotional Graphic with Growth Chart
Content Quality Improvement Graphic with Magnifying Glass
Modern Career Development Infographic Design with Glassmorphism
Infographic on Influencer Marketing Performance Metrics
Market Research Presentation Graphic with Trend Analysis
Visual Representation of Charts and Data Overview
Audience Interests Infographic with Data Visualization
Engaging Research Summary Graphic Highlighting Key Statistic
Dynamic Presentation Scene with Engaging Visual Elements
Customer Reviews Infographic Highlighting Company Benefits
Modern Business Presentation Slide with Text and Graph
Modern Presentation Slide with Data Visualization
Data Visualization for Influencer Marketing Performance
Infographic on Scalability Options with Growth Chart
Business Growth Promotion Graphic with Chart Elements
Promotional Graphic for Customer Rating Improvement
KPI Performance Metrics Graphic for Business Analysis
Employee Benefits Presentation Slide with Salary Trends Graph
3D Bar Graph Representation of Conversion Rate Changes
Infographic on Competitive Advantages in Business Strategy
Cognitive Psychology Infographic with Key Points
Professional Data Analysis Presentation Graphic
3D Web Design Concept with Hypothesis Explanation
Investment Growth Infographic for Financial Analysis
Business Performance Analysis Graphic with Trend Chart
Traffic Analysis Infographic with Growth Metrics
Market Overview Infographic Featuring Growth Insights
Customer Satisfaction Enhancement Graphic
Customer Advice Graphic with Informative Design Elements