Search
Sign In
Auto
2:3
Auto
2:3
Visual Representation of Charts and Data Overview
/
Free
/
Collection:
Base
/
by davooda
/
Type: PNG
/
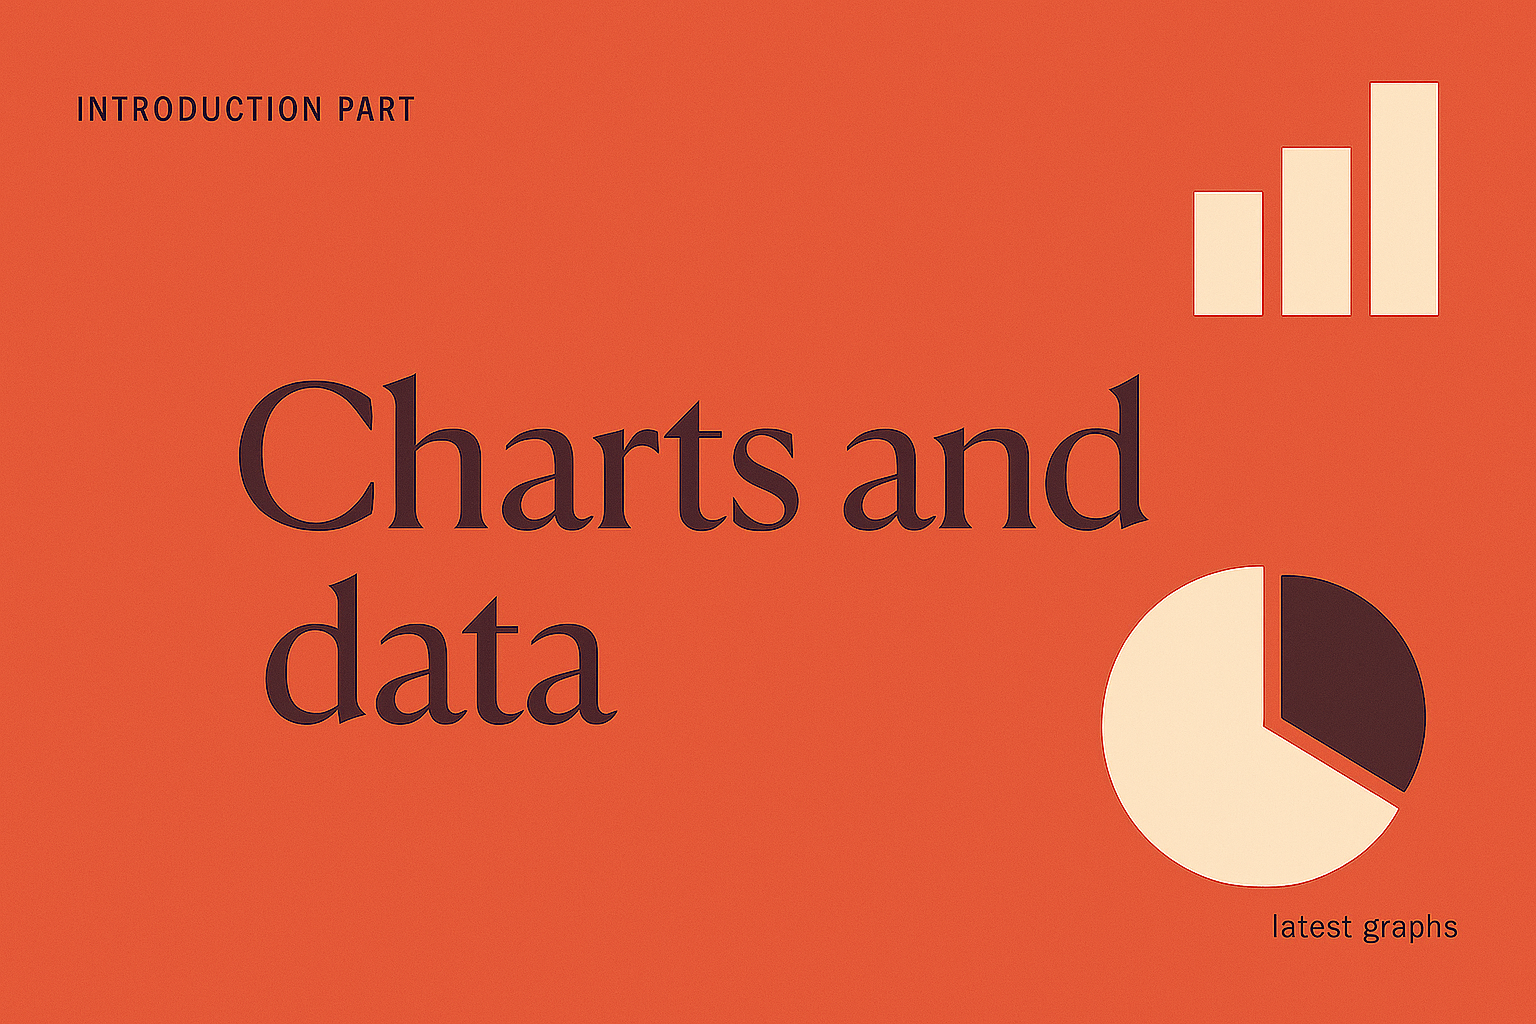
An engaging graphic showcasing the theme of charts and data. It features a pie chart, bar graph, and stylish typography on a warm background.
Visually Engaging Charts and Data Design
Infographic on Statistics and Data Analysis in Neon Design
Infographic Illustrating Information Components
Dynamic Data Presentation and Evaluation Illustration
Visual Representation of Charts and Data with Modern Design Elements
Colorful Charts and Data Visualization Design
Modern Charts and Data Visualization Introduction
Stylized 3D Chart Icon for Document Visualization
Elegant Food Menu Design with Floral Elements
Colorful Infographic Design with Data Visualization Elements
Miniature Real World: Detailed 3D Data Analysis Scene
Professional Data Analysis Presentation Graphic
Data Analytics Promotional Graphic with Modern Design Elements
3D Candlestick Chart with Gold Coins Illustration
Statistics and Data Analysis Infographic with Neon Elements
Detailed 3D Scene Depicting Data Analysis Process
Modern Data Analysis Graphic with Insights Theme
Detailed 3D Graph Illustration with Text Elements
Stylish 3D Data Analytics Icon in Isometric View
3D Graph and Chart Icons for Data Visualization
Cinematic Data Display on Laptop with Analytics
Modern Technological Design with Research Theme
KPI Infographic for Data Visualization and Analysis
3D Scene of Data Analysis with Laptop and Graphs
Woman Holding Crypto Coins with Financial Charts Background
3D Document Icon with Graphs and Pencil Design
Data Analytics Illustration with Graphs and Percentages
Detailed 3D Illustration of Data Visualization
3D Graph Analysis Illustration with Insights
Detailed 3D Graph Illustration with Action Button and Text
Detailed 3D Graph Illustration for Data Analysis
Festive Christmas Greeting Card with Tree and Presents
3D Illustration for Data Analysis Landing Page
Stylish Corporate Theme with Elegant Design Elements
Interactive Heat Map Visualization Interface for Data Analysis
3D Scene of Data Analysis and SEO in Vibrant Colors
Colorful 3D Bar Chart Icon Representing Data Growth
Elegant Corporate Research Theme Design
Colorful Infographic Design Illustrating Data Visualization Concepts
Data Analysis Infographic with Modern Design Elements
Stylized Bar Chart Illustration for Data Visualization
3D Icon Representing Grid Trading with Volumetric Design
3D Bar Graph Representation of Conversion Rate Changes
3D Icon of a Growth Chart on Clipboard
Fluorescent Shadow Object with Chart Illustration
Modern Document Icon with Graph Elements
Astronomical Infographic on Nebulae and Galaxies
Stylish 3D Isometric Icon for Presentation Decks
3D Graph Presentation on Flip Chart
3D Downloadable Chart Icon with Transparent Background
Modern Information Design: Data Usage Visualization
Modern Trendy Charts Promotional Graphic
3D Data Icon Representing Big Data Concepts
3D Visualization of SEO Data Analysis and Optimization Techniques
3D Market Analysis Visualization with Graphs and Arrows
3D Render of a Presentation Board with Pie Chart
Color and Text Change in Thesis Design
3D Graph Icon Representing Data Trends
Elegant Three-Color Patterns Featuring Botanical Elements
3D Illustration of Statistics with Visual Features
3D Bar Graph Displaying Conversion Rates Over Four Months
Elegant Colorful Patterns with Stylish Typography
Elegant Green Design for Research Edition Three
Dynamic Business Digital Graph Chart for Growth Investment
3D Bar Chart Icon with Magnifying Glass in Isometric View
Colorful 3D Bar Graph with Isometric View
3D Landing Page Design with Analytics Features
Elegant Corporate Theme for Research Presentation
Informative Graphic on Key Performance Indicators (KPIs)
3D Bar Chart Icon Representing Growth Metrics
Modern Wall Clock with Infographic Elements
3D Web Page Design Featuring Analyst with Data Visualizations
Dynamic Data Analysis Presentation Illustration
Stylized Thesis Cover Design with Decorative Elements
3D Data-Mining Icon with Graph and Magnifying Glass
Thanksgiving Presentation Slide Featuring Chart and Seasonal Decor
Dynamic Goal Tracker Board with 3D Elements and Gradient Background
Professional Presentation Slide Mockup with Data Visualization
Colorful Patterns and Text Design for Thesis Draft
Infographic on Plastic Waste and Recycling Statistics
3D Graph Icon with Magnifying Glass for Analysis
Elegant Corporate Design with Floral Elements
Infographic Displaying KPI Progress Metrics with Visual Elements
3D Blueprint Design with Pencil and Charts
Data Analysis Concept for Sales Improvement
Elegant Patterns and Colors in Modern Design
3D Circular Graph Icon with Sections in Isometric View
3D Finance Icon with Growing Graph and Coin
Presentation Slide Featuring T-Shirt Mockup and Data Chart
3D Financial Chart Icon with Analysis Elements
Minimalist Analytics Illustration with Graphs and Data
Stylized 3D Financial Chart Icon for Analysis
Colorful Complex Patterns with Floral Elements
Cosmic Data Analysis Graphic Featuring Nebula and Galaxy
3D Magnifying Glass Over Line Graph Icon
3D Data Analysis Icon with Magnifying Glass
3D Magnifying Glass Over Graph Icon for Data Analysis
3D Bar Graph Icon Representing Data Visualization
3D Graph Icon Representing Growth Metrics
Colorful 3D Isometric Chart Icon on Transparent Background
Modern Presentation Slide with Data Visualization
Data Visualization of User and Revenue Growth Metrics
Dynamic Data Visualization for Business Process Automation
Professional Data Presentation and Evaluation Graphic
Promotional Graphic for Data Exploration Theme
Digital Data Exploration and Analytics Graphic
Infographic Highlighting Case Study Results with Graphical Elements
Interactive Data Dashboard Promotional Graphic
Case Study Results Highlighting Key Metrics
Influencer Marketing Performance Data Visualization
Financial Crisis Infographic with Dramatic Graph Elements
Engaging Research Summary Graphic Highlighting Key Statistic
Internal Presentation Slide Design Example
Professional Business Growth Strategies with Engaging Visuals
Stylish Web Design for Data Organization
Digital Exchange Platform Promotional Graphic with Data Visualization
Promotional Graphic for Financial Analysis Video
Traffic Analysis Infographic with Growth Metrics
Graphical Representation of Performance Metrics with Bold Typography
Professional Financial Advisory Promotional Image
Visual Communication Concept Graphic
Case Study Results Visual with Graphs and Statistics
Urban Development Trends Overview with Visual Elements
Email Marketing Performance Infographic Highlighting Key Metrics
Dynamic and Engaging Visual Design Promotion
Market Analysis Graphic with Data Visualization
Illustrative Graphic on Growth Metrics and Financial Trends
Creative Brand Redesign with Modern Elements
Informative Trading Strategy Graphic for Investors
Bold Visual Engagement Concept Graphic
Informative Infographic on Mobile Usage Statistics
Interactive Financial Data Dashboard Promotion
Investing Tips Graphic Comparing Crypto and Stocks
Creative Graphic Promoting Fresh Ideas and Concepts
Infographic Highlighting Key Statistics on Problem Understanding
Futuristic Graphic on AI and Quantum Computing Integration
Modern Data Visualization Graphic with Bar Chart and Engaging Design
Creative Graphic Promoting User-Focused Design Strategies
Financial Insights Dashboard for Analysis
Professional Presentation Template with Engaging Visual Elements
Urban Nighttime Infographic with Statistical Elements
Promotional Graphic for Data Exploration Video
Financial Investment Analysis Graphic with Trend Chart
Dynamic Visual on AI Transformation and Innovation
Modern Data-Driven Marketing Design for Startups
Informative Graphic on Tracking Website Performance Metrics
Financial Growth Infographic with Investment Insights
3D Graphic Landing Page for Report Generation Product
Modern Cybersecurity Trends and Solutions Graphic
Visual Guide to the Infographic Design Process