Search
Sign In
Auto
2:3
Auto
2:3
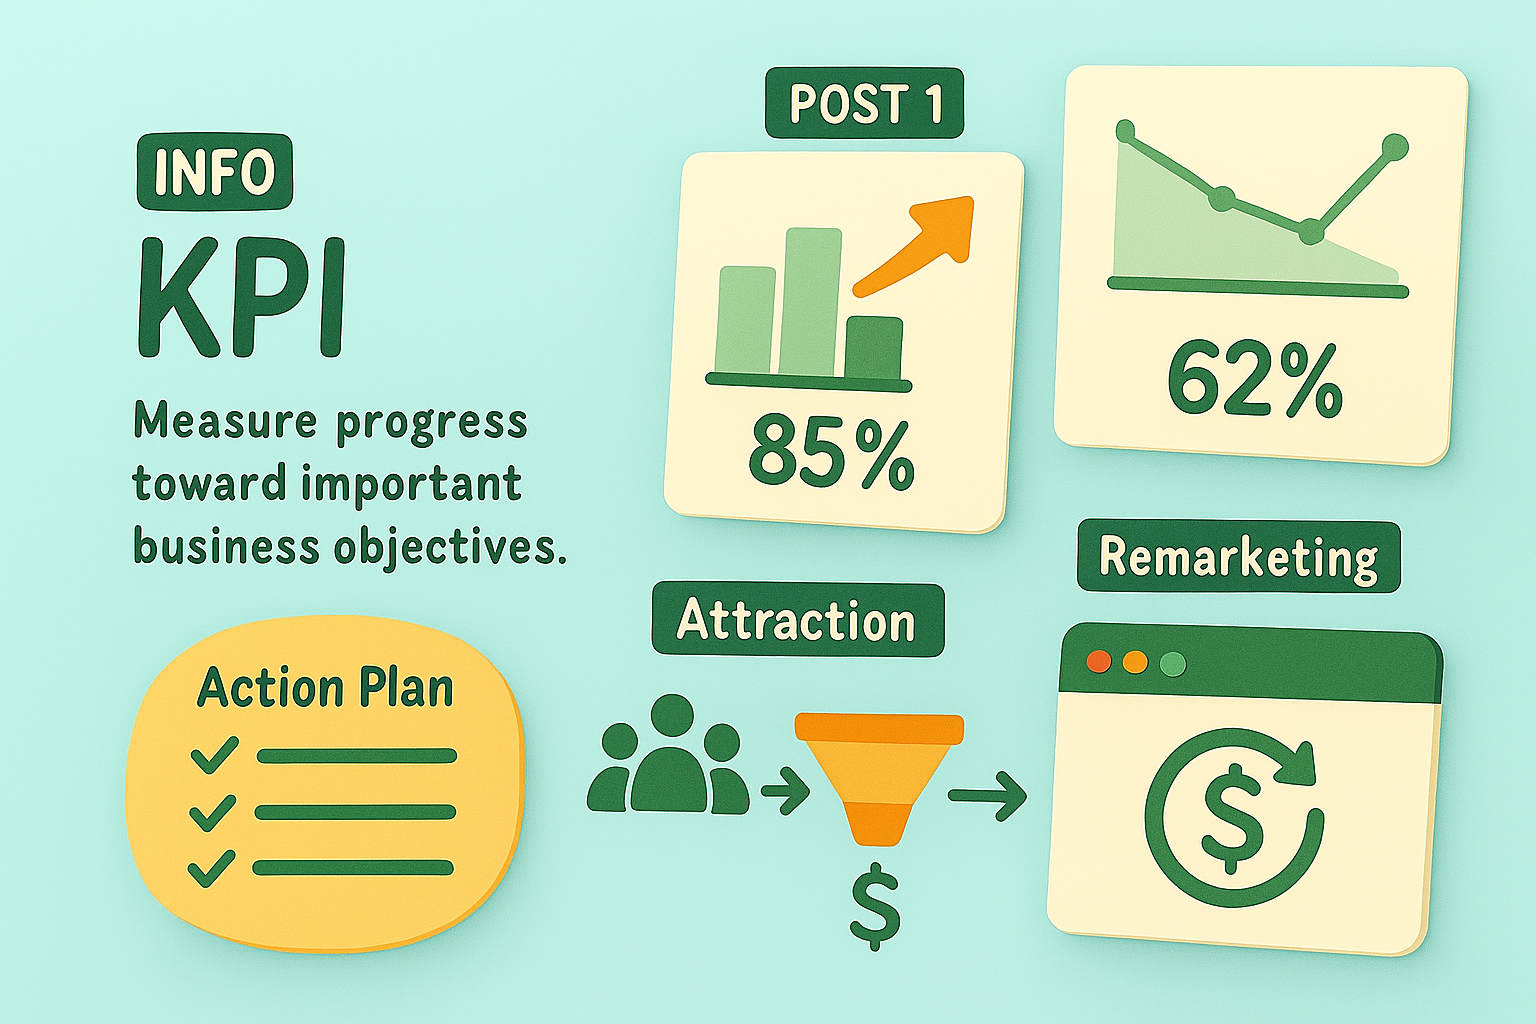
Informative KPI Graphic for Business Metrics
/
Free
/
Collection:
Let's Present
/
by davooda
/
Type: PNG
/
A vibrant infographic illustrating key performance indicators (KPIs) for business objectives, featuring graphs and icons. Ideal for presentations and reports.
Informative Graphic on Key Performance Indicators (KPIs)
Infographic Displaying KPI Progress Metrics with Visual Elements
Informative Graphic Representing Business KPIs and Marketing Strategies
Informative Graphic on Key Performance Indicators (KPIs)
Informative Graphic on KPI Posts and Lead Generation
Informative Graphic on Business Strategies and Metrics
Illustrative Infographic on Key Performance Indicators (KPI)
Colorful Infographic Illustrating Business Performance Metrics
Informative Graphic on Key Performance Indicators
Colorful Infographic Representing KPI and Action Plan Concepts
Infographic on Key Business Strategies and Metrics
Colorful Infographic on Marketing Concepts and Strategies
Marketing Performance Dashboard Graphic
KPI Performance Metrics Graphic for Business Analysis
Informative Graphic on Marketing Strategies and KPIs
Infographic Highlighting Key Performance Indicators (KPIs)
Informative Graphic on Key Performance Indicators and Action Plans
Informative Infographic on Business Strategies and Metrics
KPI Infographic for Data Visualization and Analysis
Informative Graphic on KPI Metrics for Performance Evaluation
Informative Graphic on Marketing Strategies and KPIs
KPI Comparison Graphic with Smartphone Illustrations
Infographic Elements Representing Marketing Metrics and Strategies
Informative Graphic on Marketing Strategies and KPIs
Informative Graphic on Post KPIs and Performance Measurement
Informative Graphic on Key Performance Indicators (KPIs)
Informational Graphic on Web Metrics and Strategies
Illustrative Diagram for Cybersecurity Planning and Metrics
E-commerce Marketing Infographic with Key Concepts
Illustrative Action Plan Infographic for Goal Setting
Stylized Graphic Representing Key Performance Indicators
Infographic on Marketing Strategies with Visual Icons
Informative Graphic on Cybersecurity Metrics and Strategies
Social Media Post KPI Comparison Graphic
Business Strategy Infographic Highlighting Key Metrics and Actions
Infographic on SEO Strategies with Action Plan Elements
KPI Infographic with Performance Metrics and Graphs
Digital KPI Comparison Graphic for Social Media Posts
Visual Illustration of AI Integration in Marketing Strategies
Stylized 3D Bar Graph Showing Growth Trend
KPI Post Comparison Graphic with Illustrated Tablets
Visual Representation of Key Performance Indicators for Marketing
Comparison Infographic of Post Performance Metrics
Informative Graphic on Cybersecurity Strategies
Visual Representation of Social Media Engagement Metrics
3D Infographic on Conversion Rate Calculation
Minimalist Analytics Illustration with Graphs and Data
Informative Graphic on Tracking Website Performance Metrics
Positive Growth Indicator with Thumbs Up Symbol
Creative Business Planning Concept with Sticky Notes
Infographic Illustrating Action Steps for Project Management
Modern KPI Dashboard Displaying Performance Metrics
3D Illustration on Content Marketing Strategy
Data Visualization of User and Revenue Growth Metrics
Landing Page Design for Marketing Strategies and Features
Performance Metrics Infographic with Key Indicators
3D Visual Progress Tracker Design for Web Page
Illustrative Graphic on Return on Investment Concepts
Performance Growth Chart with Positive Feedback Symbol
3D Web Design with Key Metrics Visualization
3D Laptop with Rising Graph and Charts on Purple Background
Dynamic Goal Tracker Board with 3D Elements and Gradient Background
Informative Graphic on AI Integration and Key Performance Indicators
Motivational Graphic for Goal Tracking and Progress Monitoring
Healthcare Growth Chart with Medical Elements
Colorful Informational Graphic on Marketing Concepts
Stylized Graph Showing Financial Growth with Dollar Coin
Graphical Representation of Customer Needs Growth
Illustrative Action Plan Infographic with Clear Steps
3D Growth Illustration with Unique Design Elements
Illustrative Graphic on Growth Metrics and Financial Trends
Colorful Educational Graphics for Digital Marketing Concepts
Pathway to Success: 3D Mountain Illustration with Performance Tracking
Stylized Financial Growth Chart with Dollar Coin
Data Analytics Illustration with Graphs and Percentages
Graphical Representation of Performance Metrics with Bold Typography
Dynamic Landing Page Design with 3D Elements
Informative Infographic on Campaign Performance Metrics
Data Analytics Promotional Graphic with Modern Design Elements
Business Professional Analyzing Graphs and Charts
Sales Funnel Infographic Illustrating Customer Journey
Modern Data Visualization Graphics on Transparent Panels
Growth Chart with Rising Arrow Illustration
Product Presentation Overview with Scenic Background
Infographic on Plastic Waste and Recycling Statistics
Close-up of a Dart Hitting a Colorful Target Board
3D Illustration of Channel Growth Metrics on a Computer Screen
Modern Graph Icon Illustrating Growth and Progress
Infographic on Software Development Metrics with Illustrative Style
Conceptual Growth Illustration with Green Plant
Boho Style Landing Page Design with Footer
3D Illustration of a Target with Goal Description Card
Bullseye Target with Arrow Hitting Center at Sunset
Engaging Digital Marketing Infographic on Call to Action Strategies
Modern Information Design: Data Usage Visualization
Close-up of a Dartboard with an Arrow Hitting the Center
Infographic on Influencer Marketing Performance Metrics
3D Web Design Concept Featuring Growth Metrics
Stylized 3D Icon of a Deadlift in Soft Glow
Minimalist Landing Page Design for Marketing Software
Market Analysis Graphic with Data Visualization
Business Analytics Concept with KPI Dashboard Visuals
Email Marketing Performance Infographic Highlighting Key Metrics
Colorful Infographic Design Illustrating Data Visualization Concepts
Financial Dashboard Visualization with Data Insights
Financial Insights Dashboard for Analysis
Professional Data Presentation and Evaluation Graphic
Business Audit Infographic with Key Performance Indicators
Modern Data Analysis Graphic with Insights Theme
Financial Growth Infographic with Investment Insights
Business Performance Analysis Graphic with Trend Chart
Business Growth Promotion Graphic with Chart Elements
Marketing and Sales Strategy Graphic with Key Points
Business Planning Concept Graphic for Strategic Development
Digital Data Exploration and Analytics Graphic
Graphical Representation of Business Intelligence Concepts
Infographic on Influencer Marketing Performance Metrics
Colorful Infographic Design with Data Visualization Elements
Modern Data Transfer Infographic with Growth Metrics
Investment Portfolio Growth Analytics Graphic
Market Growth Trends Visualization with Strategic Insights
Performance Meter Graphic Indicating High Performance Level
Informative Product Features Graphic with Icons
Business Audit Infographic for Financial Strategy Insights
Traffic Analysis Infographic with Growth Metrics
Business Conference Promotion with Key Metrics
Performance Gauge Graphic with Engaging Visual Elements
Dynamic Business Analytics Graphic with Economic Charts
Business Positioning Concept Graphic with Icons
Neighborhood Features Infographic with Icons and Text
Goal Tracking Illustration with Growth Metrics
Financial Investment Analysis Graphic with Trend Chart
Business Growth Concept Graphic with Charts and Arrow
Financial Growth Infographic Highlighting ROI
Achievement Recognition Graphic Featuring Success Metrics
Cloud Computing Infographic with Visual Elements
Modern Information Technology Graphic with Key Focus Areas
Performance Meter Graphic Indicating Efficiency Level
Futuristic Network Infographic Design with Key Features
Professional Growth Achievement Graphic with Progress Bar
Informative Graphic on Social Media Engagement
Finance Technology Concept Graphic for Business and Asset Management
Customer Satisfaction Infographic with Diverse Employee Representation
Infographic Highlighting Business Statistics with Rocket Theme
Interactive Data Dashboard Promotional Graphic
Professional Business Growth Strategies with Engaging Visuals
Digital Transformation Growth Chart Graphic
Financial Investments Growth Concept Graphic
Holiday Sales Analytics Infographic with Visual Elements
Professional Business Meeting Graphic with Data Visualization