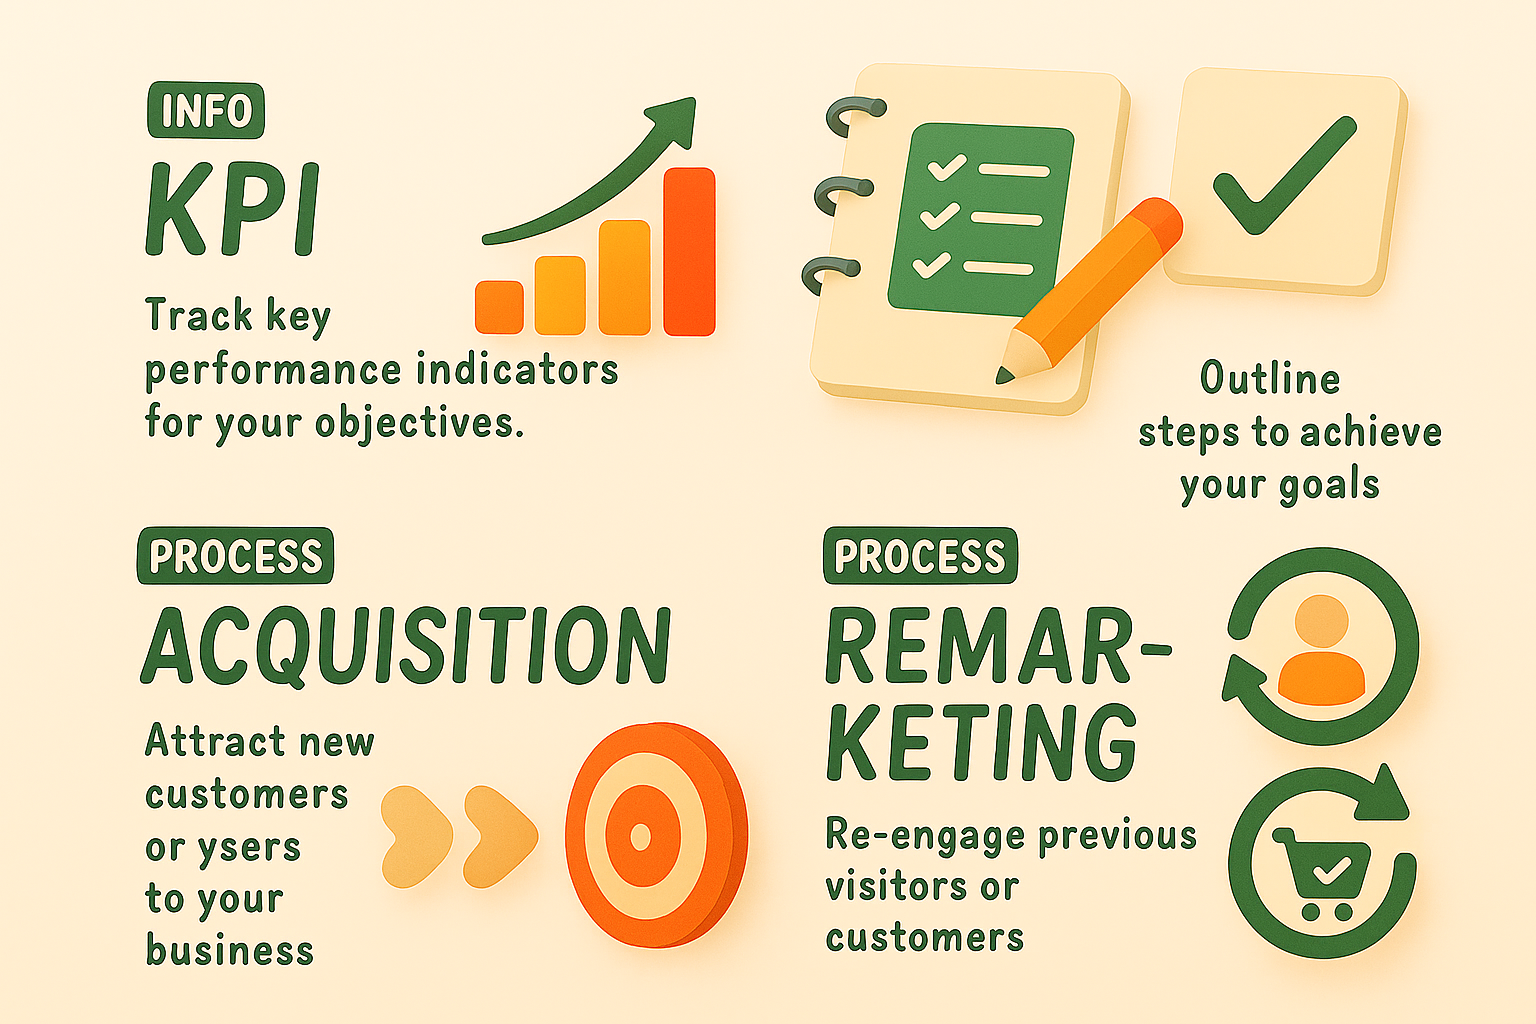
Informative Graphic on Marketing Strategies and KPIs
/Free/Collection: /by davooda/Type: PNG/Illustrative infographic detailing key performance indicators and marketing processes, utilizing vibrant colors and icons to engage the audience effectively.