Search
Sign In
Auto
2:3
Auto
2:3
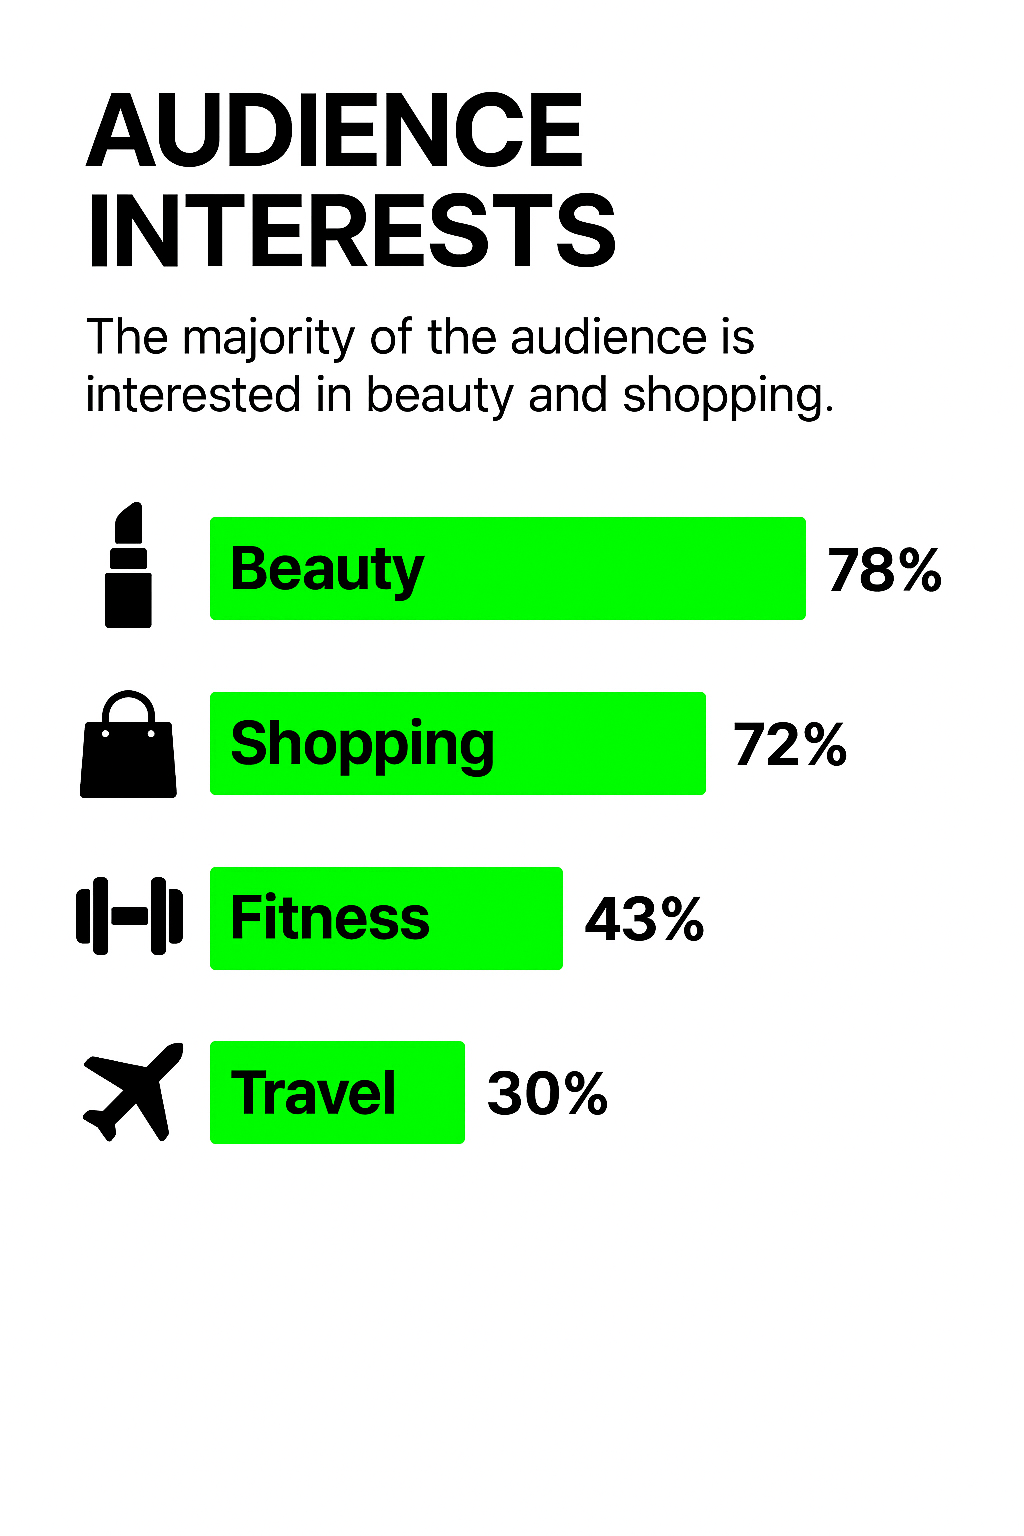
Audience Interests Infographic with Data Visualization
/
Free
/
Collection:
Basic Green
/
by davooda
/
Type: PNG
/
Informative infographic displaying audience interest statistics using vibrant green bars. Ideal for market research presentations and audience analysis.
Audience Demographics Pie Chart Illustration
Data Visualization for Influencer Marketing Performance
User Demographics Bar Chart with Age Distribution
Illustrative Graphic on Target Audiences with Demographic Insights
Infographic on Audience Analysis for Influencer Engagement
Holiday Insights Infographic with Statistics and Visual Elements
E-Commerce Trends Infographic with Engaging Visual Elements
Infographic on Influencer Marketing Performance Metrics
Influencer Marketing Performance Metrics Graphic
Illustrative Graphic Representing Audience Segmentation
Infographic Representing Gender Follower Distribution
Infographic on Influencer Marketing Performance Metrics
Target Audience Concept Illustration with Icons and Graphics
Influencer Marketing Performance Data Visualization
Influencer Marketing Performance Graphic with Data Visualization
Data Visualization of Influencer Marketing Performance Over Time
Revenue Trend Graph Illustrating Audience Insights
Illustrative Graphic of Audience Engagement on Mobile Device
Infographic on Social Media Usage by Age Group
Digital Marketing Concept with Audience Targeting Graphics
Data Visualization for Influencer Marketing Performance
Influencer Marketing Performance Analysis Graphic
Informative Graphic on Audience Interests and Engagement
Influencer Marketing Performance Analysis Graphic
Infographic on Audience Segmentation with Pie Chart
Performance Metrics Infographic with Key Indicators
Stylized Illustration of Influencer PR Package Concept
Graphical Representation of Customer Needs Growth
Stylish Web Page Design for Fashion Buyer Role
Data Visualization of User and Revenue Growth Metrics
Promotional Black Friday Shopping Graphic with Bold Typography
Digital Marketing Performance Graphic with Data Visualization
Colorful Infographic on Influencer Marketing Strategies
Infographic Illustrating the Customer Journey Stages
Influencer Marketing Performance Dashboard Illustration
Influencer Marketing Performance Report Graphic
Minimalist Loyalty Rewards Promotional Graphic
Minimalist E-commerce Illustration with Shopping Cart
Stylized Representation of Population Segmentation
Illustration of Buyer Persona Concept for Marketing
Informative Pizza Consumption and Popularity Graphic
Infographic on Competitive Advantages in Business Strategy
Email Marketing Performance Infographic Highlighting Key Metrics
Illustrative Graphic on Target Audiences in Marketing
Statistical Graphic Highlighting Legal Service Importance
Natural Skincare Awareness Graphic with Diverse Models
Informative Graphic on Marketing Strategies and KPIs
Influencer Marketing Performance Analysis Graphic
Infographic on Advertising Budget Distribution by Medium
Competitor Analysis Graphic with Visual Elements
Audience Targeting Graphic with Heart Motifs
Vibrant Festival Audience Captivated by Performance
Illustrative Graphic on Audience Engagement in Social Media
Loyalty Rewards Graphic with Modern Icons
Infographic on Influencer Marketing Strategies
Minimalist Icon Graphic with Heart and Paper Plane
Colorful Skincare Routine Graphic for Influencers
Infographic on Audience Targeting Strategies
Market Research Presentation Graphic with Trend Analysis
E-commerce Trends Graphic with Data Visualization
Graphic Representation of Social Media Engagement
Illustrative Graphic Representing Target Audience Concept
Graphical Representation of Performance Metrics with Bold Typography
Informative Graphic on Business Strategies and Metrics
Informative Infographic on Plastic Waste Statistics
Influencer Marketing Performance Graphic with Engaging Visuals
Informative Graphic on Influencer Marketing Strategies
Multicultural Beauty: Diverse Women with Radiant Skin
Minimalist Analytics Illustration with Graphs and Data
Colorful Infographic Representing KPI and Action Plan Concepts
Illustrative Graphic of Influencer Marketing Concept
Performance Gauge Icon with Bold Typography
Promotional Graphic for Loyalty Rewards Program
Email Sign-Up Form Design for Haircare Tips
Illustration of Influencer Sharing Skincare Routine
Infographic on Key Business Strategies and Metrics
Market Research Infographic Summary with Key Insights
Illustration of Skincare Routine for Influencers
Digital E-Shopping Concept with Smartphone Illustration
Vibrant Nightclub Scene with Market Insights
Promotional Image Showcasing Singapore's Cityscape and Beauty
Data Analytics Illustration with Graphs and Percentages
Illustration of Online Shopping Experience with Laptop and Shopping Bags
Festive Holiday Shopping Concept with Christmas Tree in Cart
Colorful Infographic on Marketing Concepts and Strategies
E-commerce Promotional Graphic with Shopping Cart
Dynamic Neon Art Design Featuring Podcast Microphone
Glowing Objects in a Financial Context
Performance Meter Graphic with Bold Typography
3D Infographic on Conversion Rate Calculation
Cosmetic Marketing Infographic Featuring Lipstick Trends
Diverse Group Celebrating Natural Beauty and Skin Confidence
Colorful Social Media Engagement Illustration with Abstract Figures
Performance Meter Graphic Indicating Efficiency Level
Performance Gauge Graphic with Bold Typography
E-Shopping Promotional Graphic with Modern Design
Informative Infographic on Business Strategies and Metrics
Audience Targeting Concept Graphic with Vibrant Design Elements
Informative Graphic on Key Performance Indicators (KPIs)
Infographic on Plastic Waste and Recycling Statistics
Concert Attendance Data Infographic with Visual Statistics
Concert Audience Analysis Infographic
Live Concert Attendance Infographic with Statistics
Digital Engagement Infographic with Energy Bars Concept
Professional Data Presentation and Evaluation Graphic
KPI Infographic for Data Visualization and Analysis
Modern Graphic Highlighting User Ratings with Bar Graph
Digital Engagement Metrics Visualization with Energy Bars
Market Analysis Graphic with Data Visualization
Colorful Infographic Design Illustrating Data Visualization Concepts
Conference Attendance Infographic with Key Statistics
Market Growth Trends Visualization with Strategic Insights
Business Audit Infographic for Financial Strategy Insights
Informative Graphic on Social Media Engagement
Modern Data Analysis Graphic with Insights Theme
Financial Growth Infographic with Investment Insights
Visual Representation of Charts and Data Overview
Green Hydrogen Renewable Energy Infographic
Concert Stage Overview Infographic with Audience Metrics
Traffic Analysis Infographic with Growth Metrics
Customer Satisfaction Infographic with Diverse Employee Representation
Infographic on Green Recycling Concept with Statistics and Visual Elements
Event Planning Infographic with Budget and Guest List Details
Performance Gauge Graphic with Bold Typography
Infographic on Marketing Strategies with Visual Icons
Startup Ideas Infographic with Data Visualization
Informative KPI Graphic for Business Metrics
Content Monetization Analytics Graphic
Infographic Highlighting Case Study Results with Graphical Elements
Engaging Research Summary Graphic Highlighting Key Statistic
Customer Survey Graphic with Engaging Design Elements
Business Audit Infographic with Key Performance Indicators
Professional Data Analysis Presentation Graphic
Modern Presentation Slide with Data Visualization
Audience Targeting Concept with Hearts and a Bullseye
Business Strategy Infographic Highlighting Key Metrics and Actions
Informative Graphic on Christmas Candle Statistics
Illustrative Infographic on Cocktail Consumption Trends
Illustrative Infographic on Key Performance Indicators (KPI)
Promotional Graphic for Green Chemistry Initiatives in 2023
Neighborhood Features Infographic with Icons and Text
Data Analysis Infographic for Revenue Insights
Informative Graphic on Key Performance Indicators
Informative Graphic on Influencer Marketing Strategies
Informative Infographic on Mobile Usage Statistics
Infographic Displaying KPI Progress Metrics with Visual Elements
Modern digital feature highlight with data insights
Marketing Performance Dashboard Graphic
Informative Graphic on KPI Metrics for Performance Evaluation
Interactive Data Dashboard Promotional Graphic