Search
Sign In
Auto
2:3
Auto
2:3
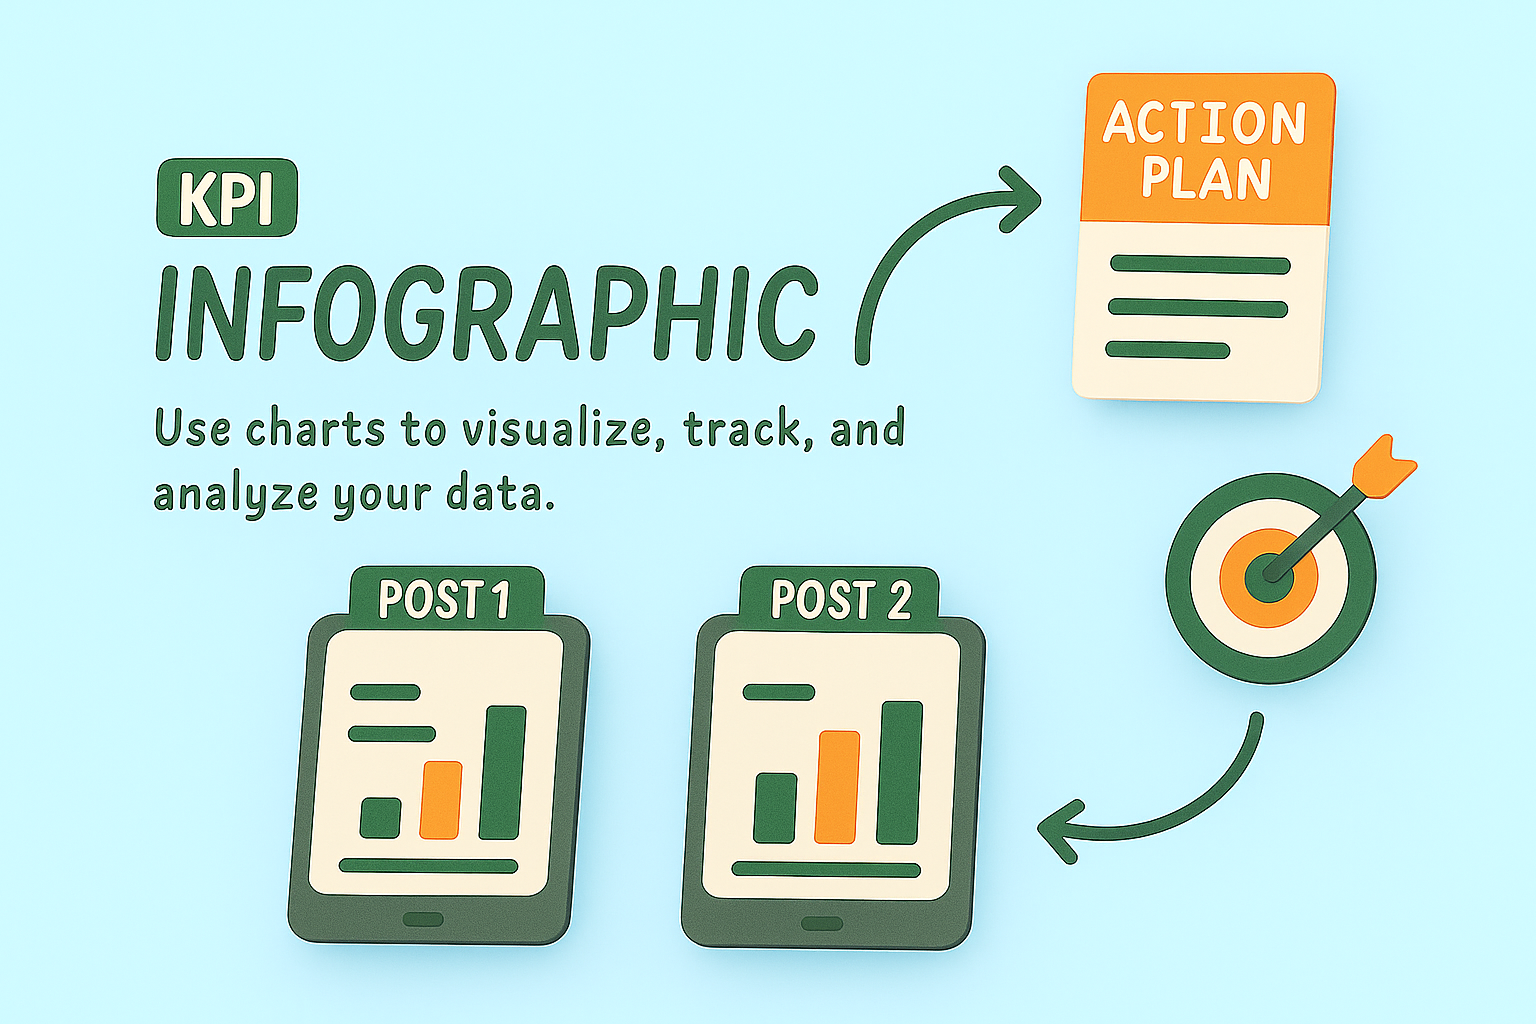
KPI Infographic for Data Visualization and Analysis
/
Free
/
Collection:
Let's Present
/
by davooda
/
Type: PNG
/
Engaging infographic illustrating the concept of KPIs with charts and a clear action plan, ideal for business presentations and data analysis.
Marketing Performance Dashboard Graphic
Informative Graphic on Key Performance Indicators (KPIs)
Illustrative Action Plan Infographic for Goal Setting
Informative Graphic on Key Performance Indicators and Action Plans
Informative KPI Graphic for Business Metrics
Illustrative Infographic on Key Performance Indicators (KPI)
Illustrative Diagram for Cybersecurity Planning and Metrics
Colorful Infographic Illustrating Business Performance Metrics
Informative Infographic on Business Strategies and Metrics
Colorful Infographic Representing KPI and Action Plan Concepts
Informative Graphic on KPI Posts and Lead Generation
Informative Graphic on Key Performance Indicators (KPIs)
Infographic Displaying KPI Progress Metrics with Visual Elements
Informative Graphic on Marketing Strategies and KPIs
Infographic on Key Business Strategies and Metrics
Informative Graphic on Marketing Strategies and KPIs
Infographic Highlighting Key Performance Indicators (KPIs)
Informative Graphic on Business Strategies and Metrics
Infographic on Marketing Strategies with Visual Icons
Colorful Infographic on Marketing Concepts and Strategies
KPI Comparison Graphic with Smartphone Illustrations
KPI Performance Metrics Graphic for Business Analysis
Infographic Elements Representing Marketing Metrics and Strategies
Infographic Illustrating Action Steps for Project Management
Social Media Post KPI Comparison Graphic
Informative Graphic on Post KPIs and Performance Measurement
Informative Graphic on Marketing Strategies and KPIs
Informational Graphic on Web Metrics and Strategies
E-commerce Marketing Infographic with Key Concepts
Business Strategy Infographic Highlighting Key Metrics and Actions
Informative Graphic on Key Performance Indicators
Data Analytics Promotional Graphic with Modern Design Elements
Infographic on SEO Strategies with Action Plan Elements
Boho Style Infographic for Step-by-Step Processes
Informative Graphic Representing Business KPIs and Marketing Strategies
Stylized Graphic Representing Key Performance Indicators
Digital KPI Comparison Graphic for Social Media Posts
Visual Illustration of AI Integration in Marketing Strategies
KPI Post Comparison Graphic with Illustrated Tablets
Illustrative Action Plan Infographic with Clear Steps
Informative Graphic on KPI Metrics for Performance Evaluation
Minimalist Analytics Illustration with Graphs and Data
Colorful Infographic Design Illustrating Data Visualization Concepts
Modern Data Analysis Graphic with Insights Theme
Informative Graphic on Key Performance Indicators (KPIs)
Modern Information Design: Data Usage Visualization
Miniature Real World: Detailed 3D Data Analysis Scene
Comparison Infographic of Post Performance Metrics
Step-by-Step Infographic with Colorful Circles
Informative Infographic on Mobile Usage Statistics
Informative Graphic on AI Integration and Key Performance Indicators
Colorful Infographic Design with Data Visualization Elements
Visual Representation of Social Media Engagement Metrics
Informative Graphic on Cybersecurity Strategies
Colorful Educational Graphics for Digital Marketing Concepts
Informative Graphic on Cybersecurity Metrics and Strategies
Detailed 3D Illustration of Data Visualization
KPI Infographic with Performance Metrics and Graphs
Stylized 3D Bar Graph Showing Growth Trend
Data Analysis Concept for Sales Improvement
Motivational Graphic for Goal Tracking and Progress Monitoring
YouTube Analytics Visualization for Performance Tracking
Workflow Process Overview Infographic with Steps
Illustrative Graphic on Influencer Marketing Analytics
Engaging Digital Marketing Infographic on Call to Action Strategies
Visual Representation of Key Performance Indicators for Marketing
Colorful Informational Graphic on Marketing Concepts
Creative Graphic on Hashtag Content Strategy
Dynamic Goal Tracker Board with 3D Elements and Gradient Background
Informative Infographic on Campaign Performance Metrics
3D Laptop with Rising Graph and Charts on Purple Background
Illustration of a Person Engaging with Analytics Growth on Mobile
Dynamic Data Analysis Presentation Illustration
Visual Guide to the Infographic Design Process
Detailed 3D Graph Illustration with Action Button and Text
Infographic on Plastic Waste and Recycling Statistics
Stylish Blue Background with Geometric Shapes and Icons
Data Analytics Illustration with Graphs and Percentages
Modern Data Visualization Graphics on Transparent Panels
3D Illustration for Data Analysis Landing Page
Futuristic Blue Abstract Background with Geometric Elements
Content Planning Graphic with Strategic Workflow Elements
Content Monetization Graphic with Earnings Overview
Detailed 3D Graph Illustration with Text Elements
Illustrative Infographic of a Workflow Process
Modern Information Design for Data Usage Feature
Business Professional Analyzing Graphs and Charts
Healthcare Growth Chart with Medical Elements
Financial Dashboard Visualization with Data Insights
Illustration of a Workflow Process with Interactive Elements
Revenue Trend Graph Illustrating Audience Insights
Positive Growth Indicator with Thumbs Up Symbol
Dynamic Financial Chart with Rising Trends and Urban Background
Dynamic Landing Page Design with 3D Elements
Landing Page Design Featuring 3D Illustration for Lepton Tool
Dynamic Business Digital Graph Chart for Growth Investment
Content Monetization Analytics Graphic
Sales Funnel Infographic Illustrating Customer Journey
Goal Tracking Illustration with Growth Metrics
Dynamic Business Meeting with Team Collaboration and Strategy Planning
Market Analysis Graphic with Data Visualization
Professional Data Presentation and Evaluation Graphic
Performance Metrics Infographic with Key Indicators
Informative Graphic on Tracking Website Performance Metrics
Financial Insights Dashboard for Analysis
Digital Data Exploration and Analytics Graphic
Business Analytics Concept with KPI Dashboard Visuals
Email Marketing Performance Infographic Highlighting Key Metrics
Business Planning Concept Graphic for Strategic Development
Interactive Data Dashboard Promotional Graphic
Visual Representation of Charts and Data Overview
Professional Data Analysis Presentation Graphic
Financial Investment Analysis Graphic with Trend Chart
Financial Growth Infographic with Investment Insights
Professional Business Growth Strategies with Engaging Visuals
Business Performance Analysis Graphic with Trend Chart
Interactive Financial Data Dashboard Promotion
Modern KPI Dashboard Displaying Performance Metrics
Digital Transformation Growth Chart Graphic
Modern Data Visualization Graphic with Bar Chart and Engaging Design
Business Audit Infographic with Key Performance Indicators
Modern Presentation Slide with Data Visualization
Market Growth Trends Visualization with Strategic Insights
Traffic Analysis Infographic with Growth Metrics
Infographic on Software Development Metrics with Illustrative Style
Professional Business Meeting Graphic with Data Visualization
Marketing and Sales Strategy Graphic with Key Points
Illustrative Graphic on Growth Metrics and Financial Trends
Dynamic Data Visualization for Business Process Automation
Professional Presentation Slide with Key Points and Visual Data
Digital Engagement Metrics Visualization with Energy Bars
Modern Graphic for Enterprise Solutions with Customization Theme
Modern Data Transfer Infographic with Growth Metrics
Professional Business Presentation with Engaging Visuals
Professional Growth Achievement Graphic with Progress Bar
Business Audit Infographic for Financial Strategy Insights
Performance Gauge Graphic with Engaging Visual Elements
Dynamic Business Analytics Graphic with Economic Charts
Business Growth Promotion Graphic with Chart Elements
Influencer Marketing Performance Graphic with Data Visualization
Graphical Representation of Performance Metrics with Bold Typography
Graphical Representation of Business Intelligence Concepts
Finance Technology Concept Graphic for Business and Asset Management
Financial Growth Infographic Highlighting ROI
Influencer Marketing Performance Data Visualization
Digital Engagement Infographic with Energy Bars Concept
Modern digital feature highlight with data insights
Investment Portfolio Growth Analytics Graphic
Customer Satisfaction Infographic with Diverse Employee Representation
Internal Presentation Slide Design Example