Search
Sign In
Auto
2:3
Auto
2:3
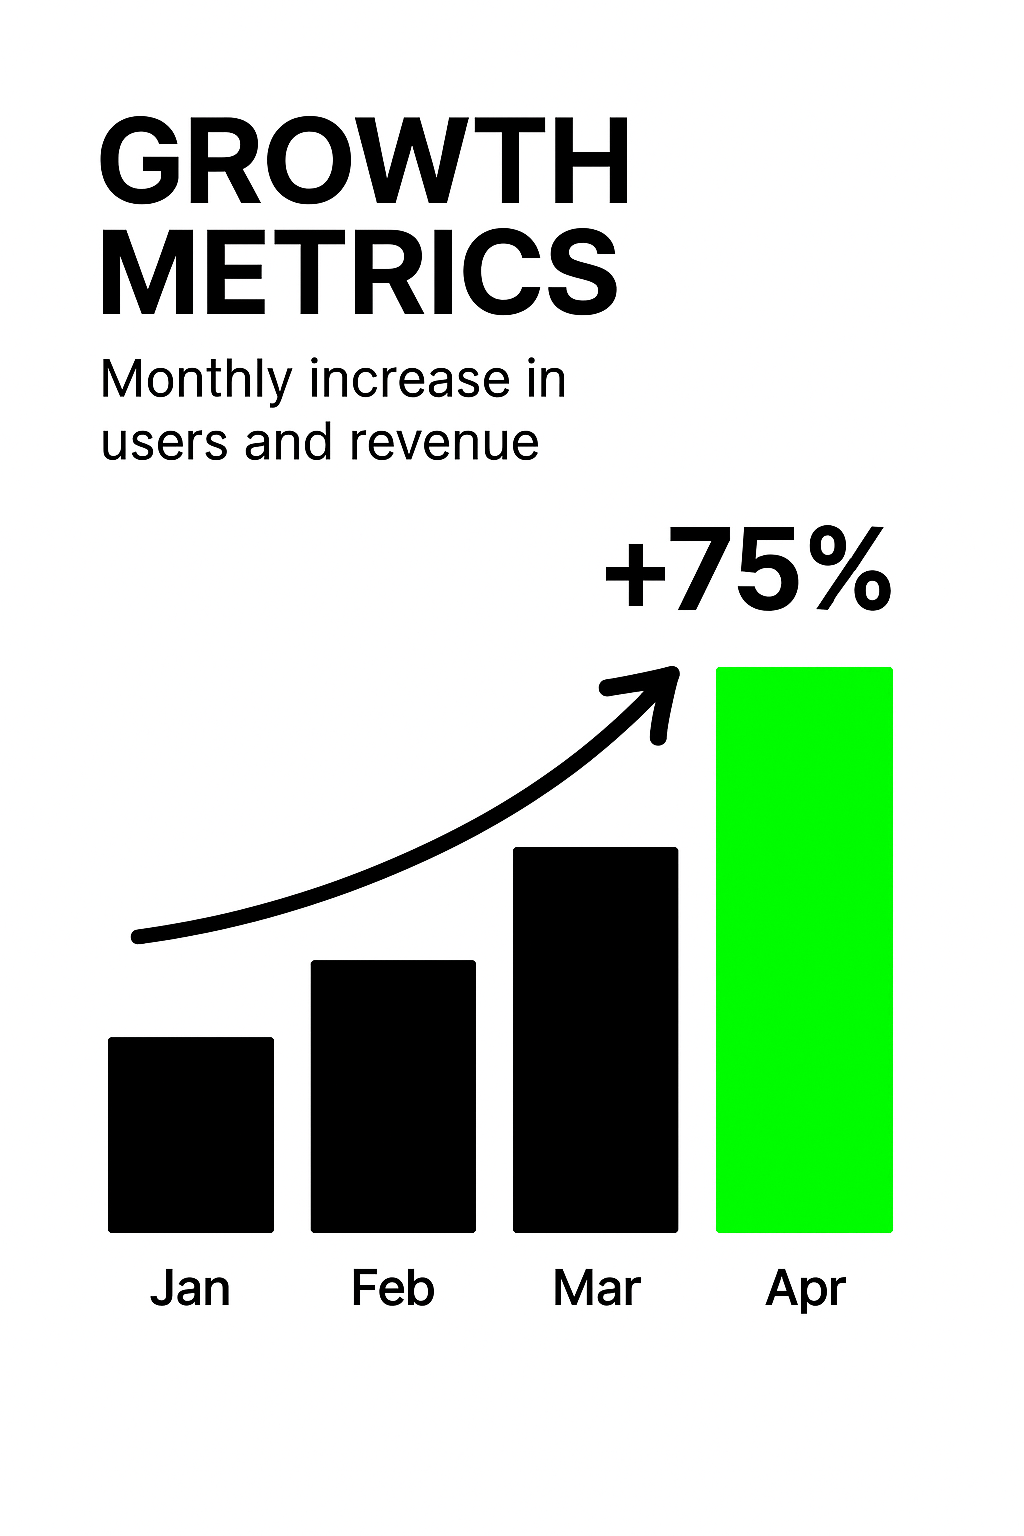
Data Visualization of User and Revenue Growth Metrics
/
Free
/
Collection:
Basic Green
/
by davooda
/
Type: PNG
/
A clean and modern infographic displaying monthly growth metrics with a focus on user and revenue increase. Ideal for business presentations and reports.
Illustrative Graphic on Growth Metrics and Financial Trends
Data Visualization of Influencer Marketing Performance Over Time
Illustration of a Person Engaging with Analytics Growth on Mobile
KPI Performance Metrics Graphic for Business Analysis
Revenue Trend Graph Illustrating Audience Insights
Minimalist Analytics Illustration with Graphs and Data
Case Study Results Highlighting Key Metrics
User Demographics Bar Chart with Age Distribution
Infographic on Influencer Marketing Performance Metrics
Infographic Highlighting Key Performance Indicators (KPIs)
Infographic on Influencer Marketing Performance Metrics
Data Visualization for Influencer Marketing Performance
Digital Marketing Performance Graphic with Data Visualization
Stylized 3D Bar Graph Showing Growth Trend
Data Analytics Promotional Graphic with Modern Design Elements
Influencer Marketing Performance Metrics Graphic
Business Growth Concept Graphic with Charts and Arrow
3D Bar Graph Representation of Conversion Rate Changes
Influencer Marketing Performance Analysis Graphic
Influencer Marketing Performance Report Graphic
Infographic Displaying KPI Progress Metrics with Visual Elements
Graphical Representation of Performance Metrics with Bold Typography
Graph Displaying User Growth and Adoption Trends
3D Web Design Concept Featuring Growth Metrics
Stylized Financial Growth Chart with Dollar Coin
Influencer Marketing Performance Dashboard Illustration
Dynamic Graphic Promoting Growth and Engagement
Modern Digital Illustration for Project Launch Promotion
Influencer Marketing Performance Graphic with Data Visualization
Data Visualization for Influencer Marketing Performance
Market Growth Trends Visualization with Strategic Insights
Conceptual Growth Illustration with Green Plant
Modern Graph Icon Illustrating Growth and Progress
YouTube Analytics Visualization for Performance Tracking
Influencer Marketing Performance Data Visualization
Professional Growth Achievement Graphic with Progress Bar
Illustration of Economic Growth with Increasing Graph
Positive Growth Indicator with Thumbs Up Symbol
Business Strategy Infographic Highlighting Key Metrics and Actions
Informative Graphic on Key Performance Indicators (KPIs)
Comparison Infographic of Post Performance Metrics
Influencer Marketing Performance Analysis Graphic
Business Startup Concept with Rocket Illustration
KPI Comparison Graphic with Smartphone Illustrations
E-Commerce Trends Infographic with Engaging Visual Elements
3D Growth Illustration with Unique Design Elements
Goal Tracking Illustration with Growth Metrics
Informative Graphic on Marketing Strategies and KPIs
Performance Metrics Infographic with Key Indicators
Informative KPI Graphic for Business Metrics
Investment Growth Performance Graphic with Bold Typography
Stylized Graph Showing Financial Growth with Dollar Coin
Business Growth Concept with Upward Arrow and Bar Chart
Healthcare Growth Chart with Medical Elements
Infographic on SEO Strategies with Action Plan Elements
Data Analytics Illustration with Graphs and Percentages
Infographic on Key Business Strategies and Metrics
Modern Information Design: Data Usage Visualization
3D Illustration for Channel Growth Analytics
Performance Growth Chart with Positive Feedback Symbol
Graphical Representation of Customer Needs Growth
Vibrant Social Media Marketing Promotional Graphic
Informative Infographic on Mobile Usage Statistics
Performance Gauge Graphic with Bold Typography
Dynamic Financial Chart with Rising Trends and Urban Background
Colorful Social Media Engagement Illustration with Abstract Figures
Infographic on Social Media Usage by Age Group
SEO Marketing Promotion with Mobile Device Visuals
Visual Representation of Key Performance Indicators for Marketing
Performance Gauge Icon with Bold Typography
E-commerce Trends Graphic with Data Visualization
Informative Graphic on Key Performance Indicators
Marketing Performance Dashboard Graphic
Informative Graphic on Key Performance Indicators (KPIs)
Bold Red Arrow Design for Growth Concept
Illustrative Graphic for Business Startup Theme
Performance Gauge Graphic with Indicator
Email Marketing Performance Infographic Highlighting Key Metrics
3D Laptop with Rising Graph and Charts on Purple Background
Growth Chart Icons Representing Business Success
Performance Meter Graphic Indicating Efficiency Level
Influencer Marketing Performance Graphic with Engaging Visuals
Performance Meter Graphic with Bold Typography
Growth Chart with Rising Arrow Illustration
Dynamic Landing Page Design with Grass Elements
Illustrative Graphic for Channel Analytics Report
Stylized Graph with Growth Arrow and Feature Box
Financial Growth Chart with Data Visualization
Social Media Engagement Promotion Graphic
Motivational Graphic for Goal Tracking and Progress Monitoring
Influencer Marketing Performance Analysis Graphic
Miniature World of Growth in a 3D Scene
Colorful Infographic Representing KPI and Action Plan Concepts
Business Launch Promotional Graphic with Growth Chart
Detailed 3D Graph Illustration with Action Button and Text
Dynamic Landing Page Design with 3D Elements
Graphic Representation of Social Media Engagement
Infographic Elements Representing Marketing Metrics and Strategies
Social Media Post KPI Comparison Graphic
Dynamic Growth Chart with Neon Effect
Visual Representation of Charts and Data Overview
Interactive Data Dashboard Promotional Graphic
Content Monetization Analytics Graphic
3D Presentation Visual with Key Features and Graphs
Interactive Financial Data Dashboard Promotion
Dynamic Data Visualization for Business Process Automation
Financial Insights Dashboard for Analysis
Traffic Analysis Infographic with Growth Metrics
Digital Exchange Platform Promotional Graphic with Data Visualization
Dynamic Real-Time Analytics Dashboard Graphic
Professional Financial Advisory Promotional Image
Visual Representation of Charts and Data with Modern Design Elements
Modern Presentation Slide with Data Visualization
Promotional Graphic for Data Exploration Theme
Live Concert Attendance Infographic with Statistics
Concert Audience Analysis Infographic
Professional Data Presentation and Evaluation Graphic
Data Analysis Infographic for Revenue Insights
Promotional Graphic for Financial Analysis Video
Financial Dashboard Visualization with Data Insights
Promotional Graphic for Data Exploration Video
Informative Graphic on Tracking Website Performance Metrics
Modern Graphic for Enterprise Solutions with Customization Theme
Concert Attendance Data Infographic with Visual Statistics
Modern Graphic Highlighting User Ratings with Bar Graph
Stylish Web Design for Data Organization
KPI Infographic for Data Visualization and Analysis
Digital Data Exploration and Analytics Graphic
Visual Overview of Virtual Presence and Identity
Dynamic Presentation Scene with Engaging Visual Elements
Modern Data Analysis Graphic with Insights Theme
Infographic Highlighting America's Football Culture and Revenue
Internal Presentation Slide Design Example
Modern dashboard interface design
Professional Data Analysis Presentation Graphic
Vibrant analytics dashboard mockup
Informative Trading Strategy Graphic for Investors
Infographic Highlighting Case Study Results with Graphical Elements
Financial Investment Analysis Graphic with Trend Chart
Modern Data Visualization Graphic with Bar Chart and Engaging Design
Modern Data-Driven Marketing Design for Startups
Professional Business Growth Strategies with Engaging Visuals
Informative Infographic on Campaign Performance Metrics
Real-Time Analytics Dashboard with Data Visualizations
Market Overview Infographic Featuring Growth Insights
Modern Infographic on Big Data in Smart Cities
Futuristic Technology Graphic Showcasing AI and Data Flow
Launch Your Business Promotional Graphic with Growth Chart
Dynamic and Engaging Visual Design Promotion
Professional CEO Introduction with Growth Metrics