Search
Sign In
Auto
2:3
Auto
2:3
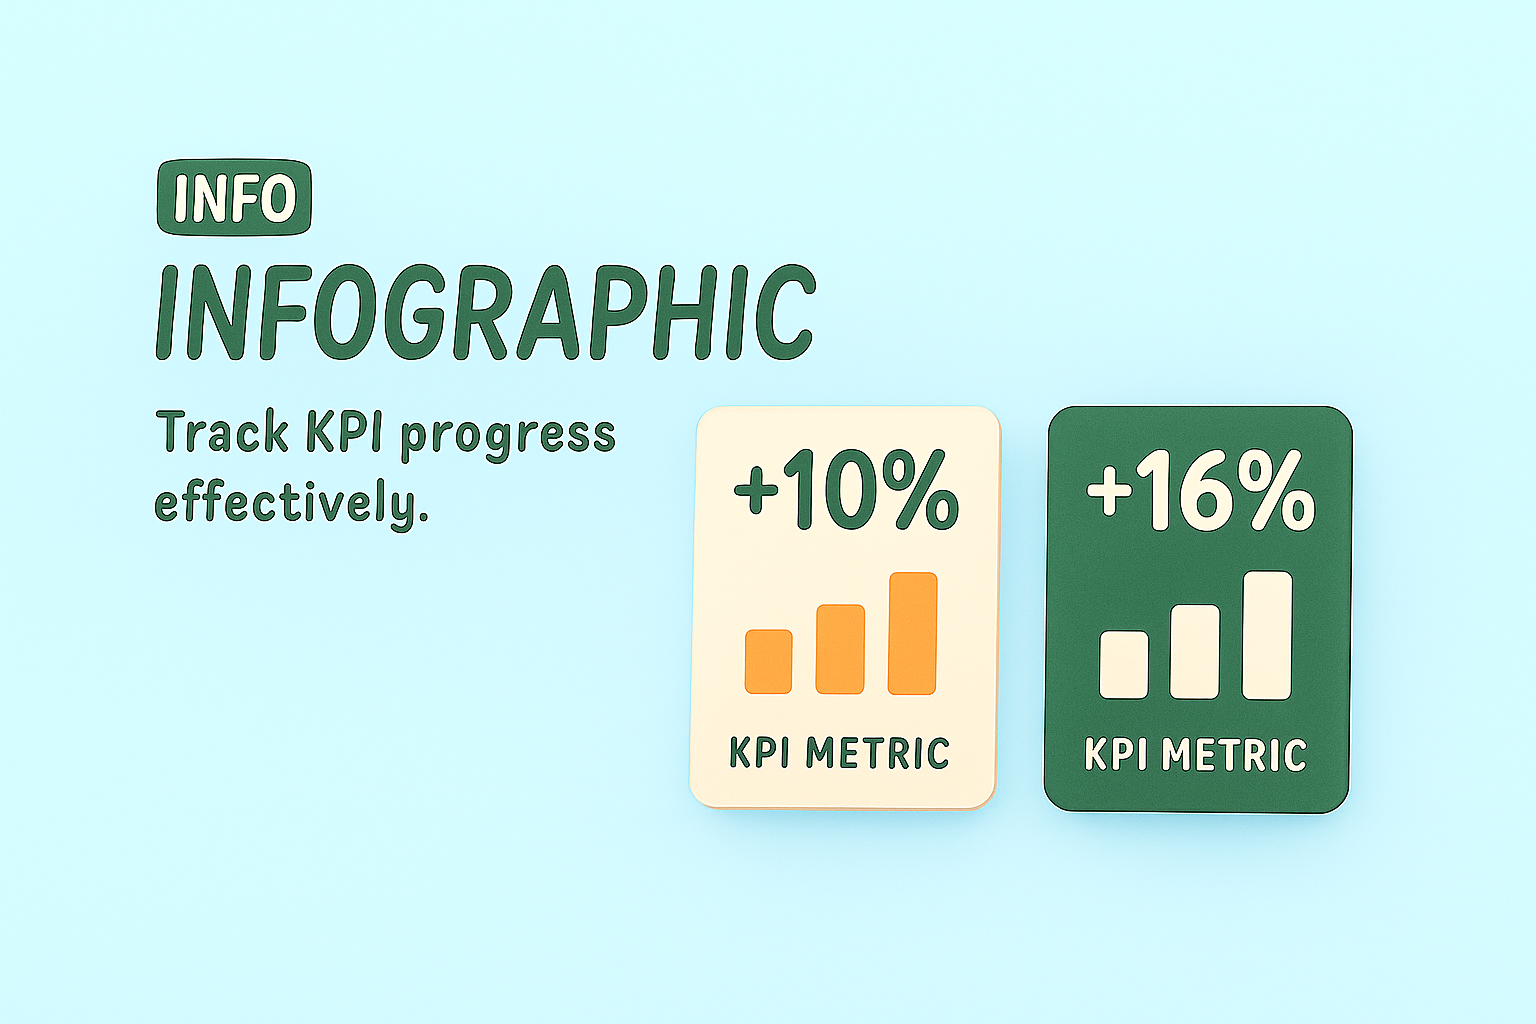
Infographic Displaying KPI Progress Metrics with Visual Elements
/
Free
/
Collection:
Let's Present
/
by davooda
/
Type: PNG
/
Colorful infographic illustrating KPI metrics with bar graph visuals, designed for effective tracking and presentation of performance data.
Informative KPI Graphic for Business Metrics
KPI Performance Metrics Graphic for Business Analysis
Infographic Highlighting Key Performance Indicators (KPIs)
Informative Graphic on Marketing Strategies and KPIs
Informative Graphic on Key Performance Indicators (KPIs)
Informative Graphic on Key Performance Indicators (KPIs)
Informative Infographic on Business Strategies and Metrics
KPI Comparison Graphic with Smartphone Illustrations
Visual Representation of Key Performance Indicators for Marketing
Colorful Infographic Illustrating Business Performance Metrics
Informative Graphic on Business Strategies and Metrics
Informative Graphic on Key Performance Indicators and Action Plans
KPI Infographic with Performance Metrics and Graphs
3D Web Design with Key Metrics Visualization
Colorful Infographic Representing KPI and Action Plan Concepts
KPI Infographic for Data Visualization and Analysis
Informative Graphic Representing Business KPIs and Marketing Strategies
Illustrative Infographic on Key Performance Indicators (KPI)
Informative Graphic on Tracking Website Performance Metrics
Stylized Graphic Representing Key Performance Indicators
3D Visual Progress Tracker Design for Web Page
Infographic on Key Business Strategies and Metrics
Informative Graphic on Key Performance Indicators
Informative Graphic on Marketing Strategies and KPIs
Marketing Performance Dashboard Graphic
Minimalist Analytics Illustration with Graphs and Data
Motivational Graphic for Goal Tracking and Progress Monitoring
Informative Graphic on KPI Posts and Lead Generation
Infographic Elements Representing Marketing Metrics and Strategies
Social Media Post KPI Comparison Graphic
Informative Graphic on Marketing Strategies and KPIs
Informative Graphic on Post KPIs and Performance Measurement
Stylized 3D Bar Graph Showing Growth Trend
Vibrant Office Space with Natural Light and Productivity Focus
Colorful Infographic on Marketing Concepts and Strategies
Graphical Representation of Performance Metrics with Bold Typography
Digital KPI Comparison Graphic for Social Media Posts
Informative Graphic on KPI Metrics for Performance Evaluation
Business Strategy Infographic Highlighting Key Metrics and Actions
Modern KPI Dashboard Displaying Performance Metrics
Modern Information Design: Data Usage Visualization
E-commerce Marketing Infographic with Key Concepts
Infographic on SEO Strategies with Action Plan Elements
Informational Graphic on Web Metrics and Strategies
Comparison Infographic of Post Performance Metrics
Positive Growth Indicator with Thumbs Up Symbol
Pathway to Success: 3D Mountain Illustration with Performance Tracking
Performance Metrics Infographic with Key Indicators
3D Laptop with Rising Graph and Charts on Purple Background
Infographic on Marketing Strategies with Visual Icons
Performance Growth Chart with Positive Feedback Symbol
Informative Graphic on Key Performance Indicators (KPIs)
Healthcare Growth Chart with Medical Elements
YouTube Analytics Visualization for Performance Tracking
Data Analytics Promotional Graphic with Modern Design Elements
KPI Post Comparison Graphic with Illustrated Tablets
Data Visualization of User and Revenue Growth Metrics
3D Growth Illustration with Unique Design Elements
Business Professional Analyzing Graphs and Charts
Stylized Graph Showing Financial Growth with Dollar Coin
Modern Data Visualization Graphics on Transparent Panels
Stylized 3D Icon of a Deadlift in Soft Glow
Visual Representation of Social Media Engagement Metrics
3D Infographic on Conversion Rate Calculation
Dynamic Goal Tracker Board with 3D Elements and Gradient Background
Stylish Blue Background with Geometric Shapes and Icons
3D Illustration for Channel Growth Analytics
3D Web Design Illustration Focusing on Performance Metrics
Colorful Infographic Design Illustrating Data Visualization Concepts
Modern Graph Icon Illustrating Growth and Progress
Data Analytics Illustration with Graphs and Percentages
Stylized Financial Growth Chart with Dollar Coin
3D Market Analysis Visualization with Graphs and Arrows
Informative Infographic on Campaign Performance Metrics
Performance Gauge Graphic with Bold Typography
Dynamic Financial Chart with Rising Trends and Urban Background
Dynamic Business Meeting with Team Collaboration on Strategy
3D Illustration of Heart Rate Monitoring Concept for Web Design
Goal Tracking Illustration with Growth Metrics
Illustrative Diagram for Cybersecurity Planning and Metrics
Growth Chart with Rising Arrow Illustration
Performance Gauge Graphic Indicating Metrics
Stylized Growth Chart with Shield Icon for Business Insights
3D Illustration on Content Marketing Strategy
Performance Gauge Icon with Bold Typography
Professional Accountant Analyzing Data with Laptop and Calculator
Colorful Informational Graphic on Marketing Concepts
Graphical Representation of Customer Needs Growth
Dynamic Business Meeting with Team Collaboration and Strategy Planning
3D Illustration for Data Analysis Landing Page
Performance Gauge Graphic with Indicator
Colorful Infographic Design with Data Visualization Elements
Performance Meter Graphic with Thumbs Up Icon
Performance Meter Graphic with Bold Typography
Data Analytics Promotional Graphic with Modern Design
Futuristic Blue Abstract Background with Geometric Elements
3D Web Page Design Featuring Productivity Tools
Modern Information Design for Data Usage Feature
Minimalist Target with Arrow Illustration
Performance Meter Graphic Indicating Efficiency Level
Business Growth Promotion Graphic with Chart Elements
Professional Data Presentation and Evaluation Graphic
Illustrative Graphic on Growth Metrics and Financial Trends
Email Marketing Performance Infographic Highlighting Key Metrics
Traffic Analysis Infographic with Growth Metrics
Infographic on Influencer Marketing Performance Metrics
Market Analysis Graphic with Data Visualization
Market Growth Trends Visualization with Strategic Insights
Business Performance Analysis Graphic with Trend Chart
Holiday Sales Analytics Infographic with Visual Elements
Professional Growth Achievement Graphic with Progress Bar
Business Audit Infographic with Key Performance Indicators
Business Analytics Concept with KPI Dashboard Visuals
Financial Growth Infographic with Investment Insights
Financial Dashboard Visualization with Data Insights
Modern Presentation Slide with Data Visualization Elements
Infographic on Statistics and Data Analysis in Neon Design
Illustrative Action Plan Infographic for Goal Setting
Infographic Highlighting Business Statistics with Rocket Theme
Market Analysis Infographic with Data Highlights
Infographic on Software Development Metrics with Illustrative Style
Modern Data Transfer Infographic with Growth Metrics
Modern Data Analysis Graphic with Insights Theme
3D Graph and Chart Illustrations for Presentations
Infographic Highlighting Case Study Results with Graphical Elements
Infographic Illustrating Information Components
Financial Growth Chart with Data Visualization
Statistics and Data Analysis Infographic with Neon Elements
Digital Engagement Infographic with Energy Bars Concept
Cloud Computing Infographic with Visual Elements
Professional Business Growth Strategies with Engaging Visuals
Business Growth Concept Graphic with Charts and Arrow
Modern Infographic on Data Transfer Concepts
Financial Insights Dashboard for Analysis
Informative Graphic on Social Media Engagement
Professional Data Analysis Presentation Graphic
Performance Gauge Graphic with Engaging Visual Elements
Customer Satisfaction Infographic with Diverse Employee Representation
Visual Representation of Charts and Data Overview
Business Performance Infographic with Graph and Happy Icon
Infographic on Green Recycling Concept with Statistics and Visual Elements
Digital Engagement Metrics Visualization with Energy Bars
Influencer Marketing Performance Graphic with Data Visualization
Dynamic Data Transfer Infographic with Modern Design
Modern Presentation Slide with Data Visualization
Investment Growth Infographic for Financial Analysis
Marketing and Sales Strategy Graphic with Key Points
Infographic on Influencer Marketing Performance Metrics
3D Graph Analysis Illustration with Insights
Financial Growth Infographic Highlighting ROI