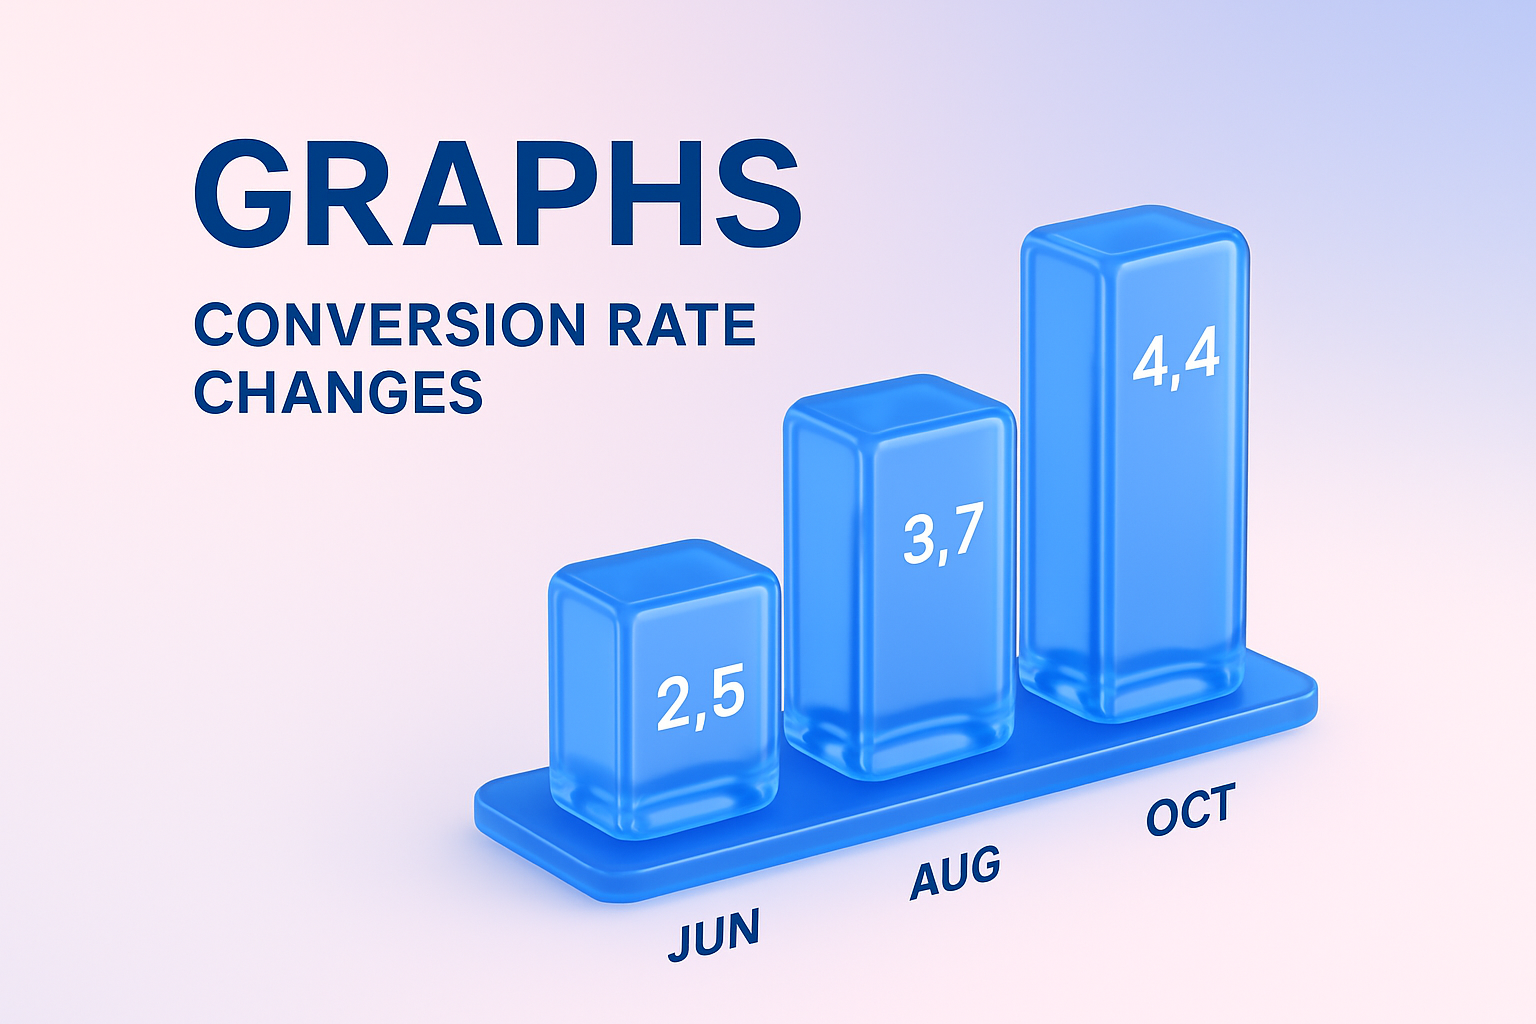
3D Bar Graph Representation of Conversion Rate Changes
/Free/Collection: /by Sergey Leonov/Type: PNG/A visually appealing 3D bar graph illustrating conversion rate changes over three months. This graphic is perfect for data presentations and marketing analysis.