Search
Sign In
Auto
2:3
Auto
2:3
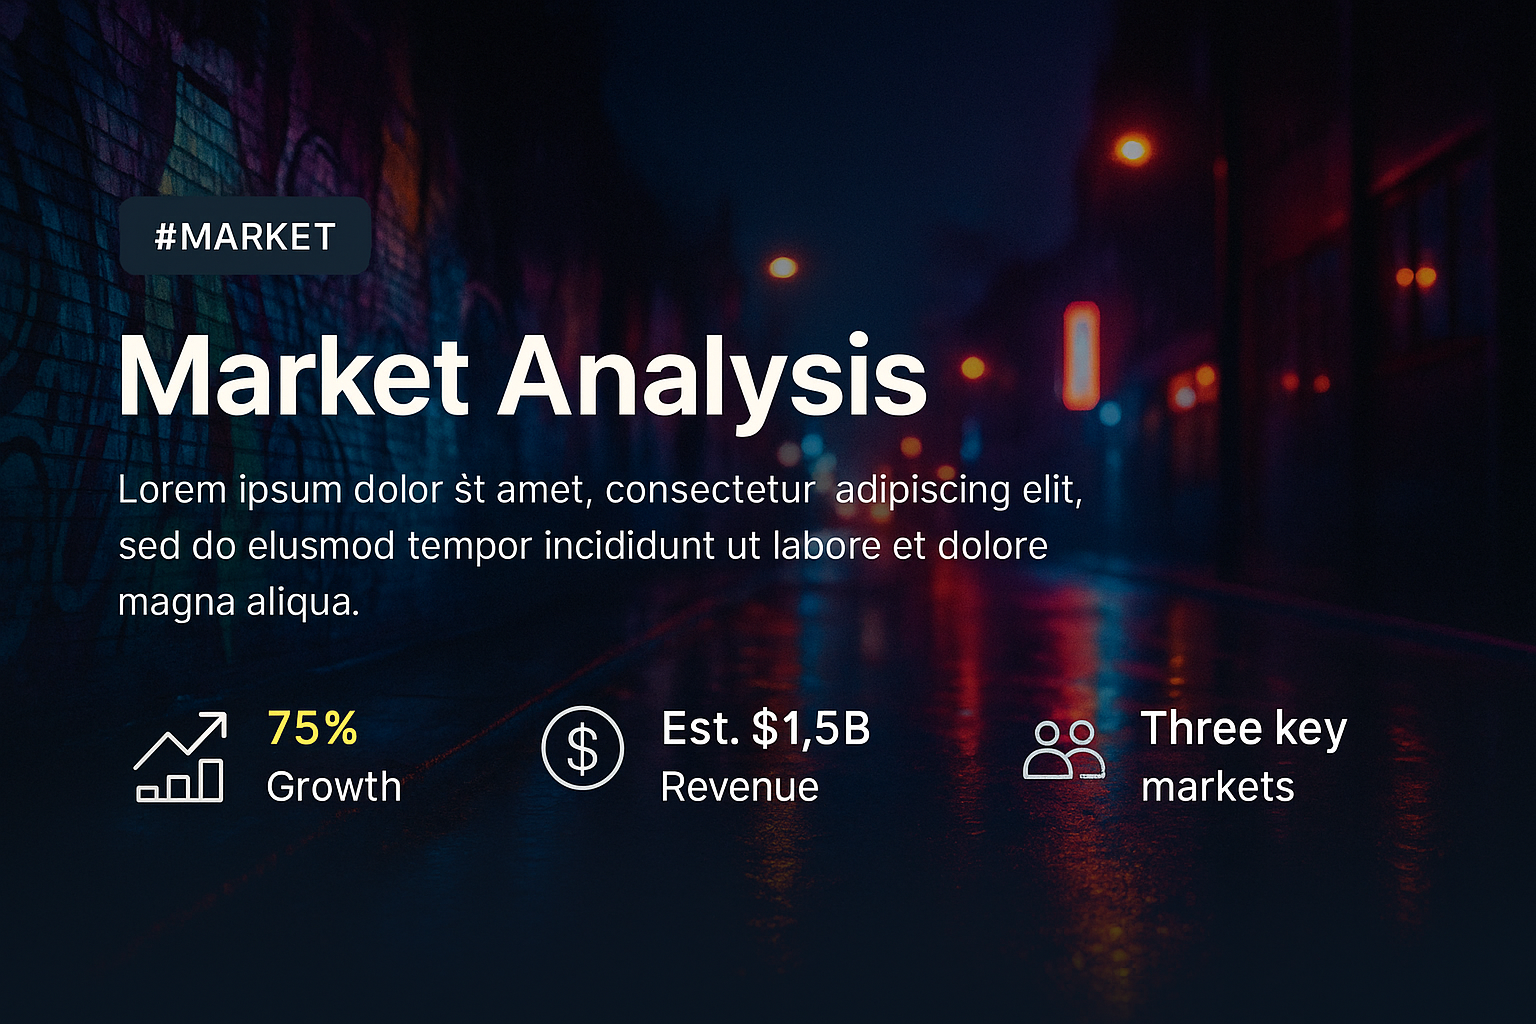
Market Analysis Graphic with Data Visualization
/
Free
/
Collection:
Base
/
by davooda
/
Type: PNG
/
Informative graphic presenting market analysis with key statistics and growth indicators. Designed for business presentations or reports.
Modern Presentation Slide with Dark Theme and Data Visualization
Market Analysis Infographic with Data Highlights
Data Analysis Infographic with Modern Design Elements
Urban Nighttime Infographic with Statistical Elements
Traffic Analysis Infographic with Growth Metrics
Market Analysis Graphic with Gold Brush Stroke
Business Strategy Overview Presentation Slide
Dark Theme Presentation Slide with Modern Design Elements
Modern Presentation Slide with Data Visualization Elements
Market Research Infographic Summary with Key Insights
Dark Themed Presentation Slide with Modern Design
Professional Presentation Template Featuring Engaging Visuals
Corporate Strategy Presentation Slide with Sales Growth Data
Dynamic Marketing Strategy Presentation Image
Modern Market Overview Graphic with Soft Waves
Concert Stage Overview Infographic with Audience Metrics
Professional Consulting Insights Graphic with Key Attributes
Financial Growth Chart with Data Visualization
Professional Presentation Slide with Ocean Background
Futuristic Metaverse City Concept Art with Data Visualization
Team Collaboration Graphic with Modern Design Elements
Conceptual Growth Illustration with Green Plant
Corporate Profile Overview with Key Metrics and Visuals
Modern Graphic for Space Exploration Themes and Initiatives
Fluorescent Shadow Object with Chart Illustration
Watercolor Cityscape Presentation Template
Futuristic High-Speed Data Visualization Graphic
Informative Graphic on Wildflowers with Data Visualization
Infographic Highlighting Startup Ideas with Market Potential
Social Media Post Highlighting Presentation Design
Futuristic Metaverse City Infographic with Neon Elements
3D Market Analysis Visualization with Graphs and Arrows
Modern Presentation Slide with Dynamic Visuals
Business Performance Analysis Graphic with Trend Chart
Corporate Presentation Slide Highlighting Revenue Growth
3D Illustration of Rocket Launching Symbolizing Startup Success
Creative Infographic Featuring Astronaut with Floral Design
Modern Technology Solutions Infographic with Data Visualization
Futuristic Travel Concept Graphic with Sales Growth Visualization
Winter Night Landscape with Text Overlay
New Year Celebration Graphic with Fireworks and Bokeh Effect
Stylish Market Research Infographic with Trend Analysis
Modern Tech Infographic Highlighting Worldwide Network Insights
Nanotechnology Concept Image with Innovation Highlights
Market Research Promotional Graphic with Vintage Style
Empty Concert Stage Presentation Slide with Data Visualization
Modern Cloud Computing Concept Graphic with Data Visualization
Vibrant Party Background with Statistics and Ideas Section
Modern Business Presentation Slide with Text and Graph
Logistics Warehouse Overview Infographic
Professional Presentation Slide with Key Points
Dynamic Music Festival Promotion Graphic with Data Visualization
Healthcare Concept Graphic with Hands Holding Heart
Serene Winter Night Landscape with Moonlight
Crypto Desk with Graphs and Coins for Market Analysis
Presentation Template with Scenic View and Key Insights
Business Conference Promotion with Key Metrics
Concert Stage Presentation Graphic with Spotlight Effects
Professional Tech Graphic Highlighting Network Technology Benefits
Professional Business Presentation Slide Featuring Hotel Concept
Business Audit Report with Graphs and Calculator
Dynamic Data Transfer Infographic with Modern Design
Modern Logistics Warehouse Overview with Informative Elements
Futuristic Abstract Background with Text Overlay
Professional Presentation Slide with Key Points and Visual Data
Modern Astronomy Theme Graphic with Earth Illustration
Cloud Computing Concept with Neon Elements and Data Visualization
Product Presentation Overview with Scenic Background
Modern Presentation Slide Featuring Rocket Launch Concept
3D Space Shuttle Launch Illustration with Business Metrics
Futuristic Metaverse City Infographic with Graphical Elements
Stylish Gradient Background with MCP Logo and Call to Action
Dynamic Presentation Slide with Abstract Design Elements
Customer Reviews Infographic Highlighting Company Benefits
Winter Night Landscape with Temperature and Conditions Details
Urban Public Park Landscape with Green Lawn
E-commerce Promotional Graphic with Shopping Cart
Dynamic Landing Page Design with Geometric Elements
Modern Infographic on Space Exploration Themes
Professional Presentation Slide Mockup with Data Visualization
New Year Celebration Fireworks Graphic
Stock Market Expansion and Business Investment Visual Concept
Modern Presentation Slide with Layered Wave Design
Cosmic Space Nebula and Galaxy Infographic
Bright Door Opening with Light Streaming In
Dynamic Financial Chart with Rising Trends and Urban Background
Modern Cloud Computing Concept Graphic with Neon Effects
Bold and Modern Testimonial Design with 3D Elements
Modern Infographic on Network Technology with Data Management Insights
Modern Neon Cyberpunk Office Interior with Tech Overlay
Modern Technology Infographic Highlighting Network Efficiency and Security
Futuristic Technology Infographic with Laptop Illustration
Dark-Themed Presentation Slide Template with Placeholder Text
Modern Cloud Computing Concept with Data Visualization
Vibrant Neon Night Club Illustration Featuring a Stylish Woman
Dramatic Spotlight Testimonials Section Design
Logistics Warehouse Overview with Informative Data
Celebratory Event Announcement with Fireworks Background
Technology Networking Event Promotional Graphic
Technology Networking Infographic with Efficiency Metrics
Market Growth Trends Visualization with Strategic Insights
Financial Investment Analysis Graphic with Trend Chart
Modern Data Analysis Graphic with Insights Theme
Financial Growth Infographic with Investment Insights
KPI Infographic for Data Visualization and Analysis
Professional Data Presentation and Evaluation Graphic
Investment Portfolio Growth Analytics Graphic
Investment Analysis Graphic with Growth Trends and Projections
Digital Data Exploration and Analytics Graphic
Market Research Presentation Graphic with Trend Analysis
Informative KPI Graphic for Business Metrics
Data Analytics Illustration with Graphs and Percentages
Financial Dashboard Visualization with Data Insights
Dynamic Business Analytics Graphic with Economic Charts
Financial Insights Dashboard for Analysis
Business Planning Concept Graphic for Strategic Development
Stock Market Analysis Graphic Featuring Trading Strategies
Illustrative Graphic on Growth Metrics and Financial Trends
Digital Transformation Growth Chart Graphic
Investment Growth Infographic for Financial Analysis
Professional Data Analysis Presentation Graphic
Investment Strategies Graphic for Stock Market Growth
Business Analytics Concept with KPI Dashboard Visuals
Colorful Infographic Design Illustrating Data Visualization Concepts
Business Growth Promotion Graphic with Chart Elements
Business Growth Concept Graphic with Charts and Arrow
Modern Presentation Slide with Data Visualization
Email Marketing Performance Infographic Highlighting Key Metrics
Graphical Representation of Business Intelligence Concepts
Data Analysis Concept for Sales Improvement
Stock Market Growth and Investment Graphic with Trend Arrow
Marketing Performance Dashboard Graphic
Abstract Investment Concept Featuring Stock Market Growth Visualization
Modern Data Transfer Infographic with Growth Metrics
Professional Business Meeting Graphic with Data Visualization
Financial Growth Chart for Stock Market Investment
Financial Investments Growth Concept Graphic
Business Funding Progress Chart with Growth Analysis
Financial Growth Chart Graphic for Investment Trading
Modern Data Visualization Graphic with Bar Chart and Engaging Design
Performance Metrics Infographic with Key Indicators
Data Analytics Promotional Graphic with Modern Design Elements
Business Presentation Announcement with Modern Design
KPI Infographic with Performance Metrics and Graphs
Financial Growth Infographic Highlighting ROI
Financial Growth and Investment Concept with Stock Market Trends
Visual Representation of Charts and Data Overview
Infographic Displaying KPI Progress Metrics with Visual Elements
KPI Performance Metrics Graphic for Business Analysis
Professional Growth Achievement Graphic with Progress Bar