Search
Sign In
Auto
2:3
Auto
2:3
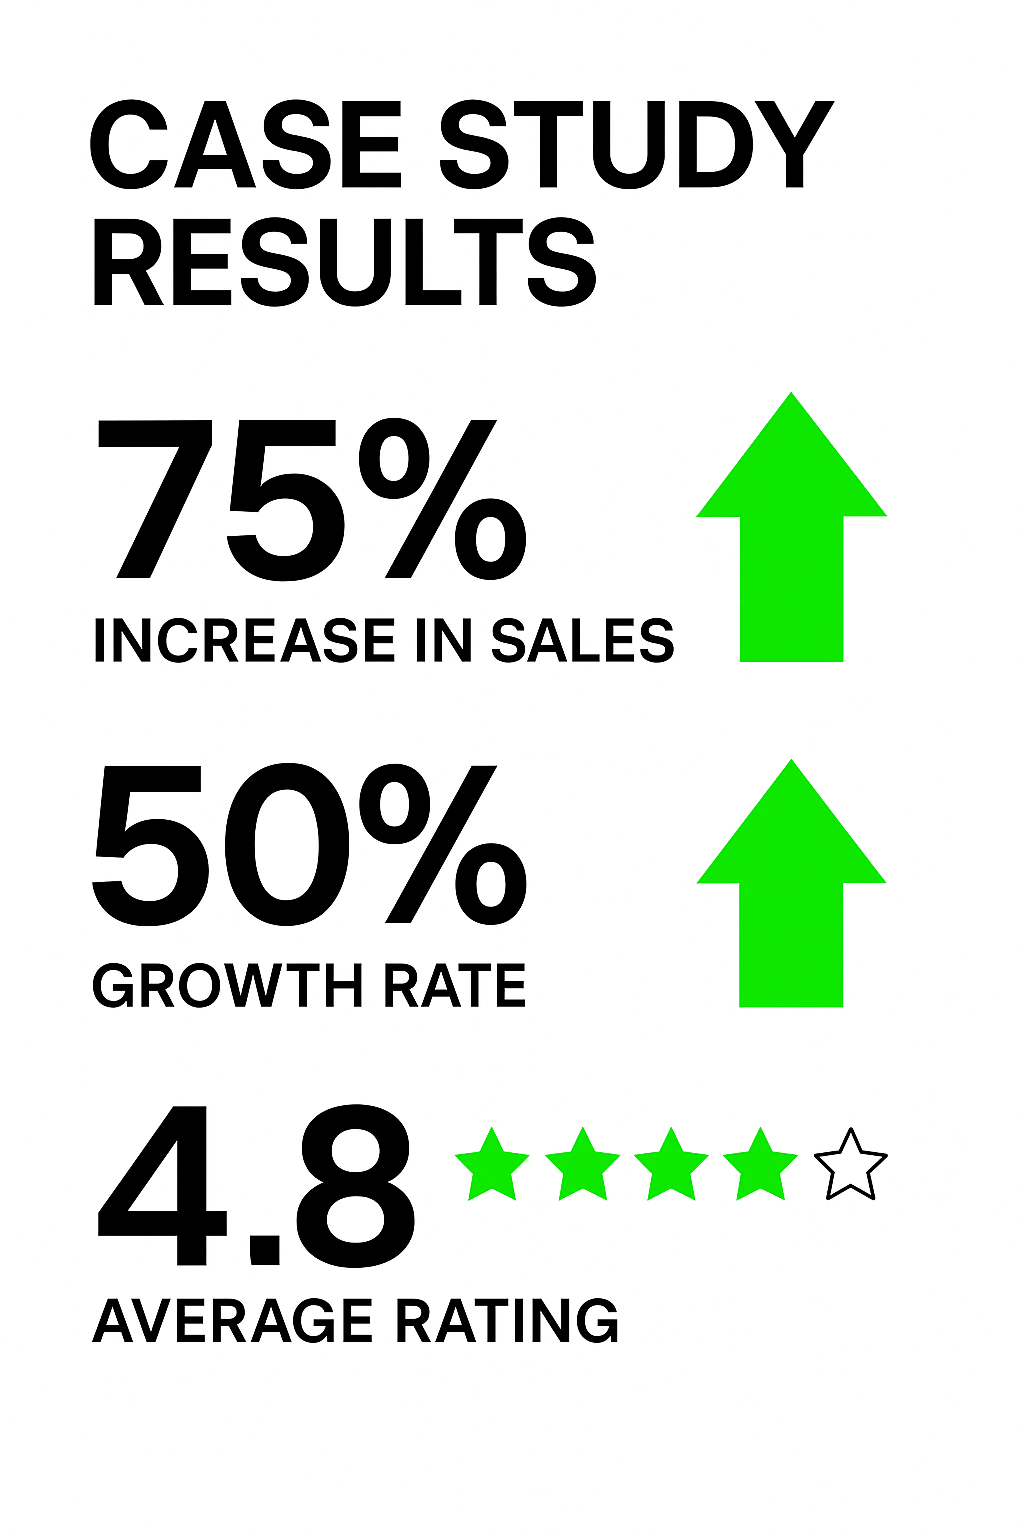
Case Study Results Highlighting Key Metrics
/
Free
/
Collection:
Basic Green
/
by davooda
/
Type: PNG
/
Informative graphic showcasing significant growth metrics from a case study, using bold typography and vibrant colors to attract attention, ideal for business presentations.
Infographic Highlighting Case Study Results with Graphical Elements
Data Visualization of User and Revenue Growth Metrics
Customer Testimonials Graphic with Star Ratings
Graphical Representation of Performance Metrics with Bold Typography
Graphic Representation of Case Studies with Document Icons
Positive Growth Indicator with Thumbs Up Symbol
Performance Metrics Infographic with Key Indicators
Case Study Results Visual with Graphs and Statistics
Stylized Financial Growth Chart with Dollar Coin
Graphical Representation of Customer Needs Growth
Corporate Team Success Celebration Image
Modern Testimonial Graphic with Bold Typography
Infographic Highlighting Key Performance Indicators (KPIs)
Stylized 3D Bar Graph Showing Growth Trend
Customer Testimonials Graphic Featuring Ratings
Minimalist Testimonials Graphic Featuring Positive Feedback
Customer Testimonial Graphic with Star Ratings
Modern Graph Icon Illustrating Growth and Progress
Customer Testimonial Graphic with Star Ratings
Performance Gauge Graphic with Bold Typography
Customer Review Illustration on Smartphone
Customer Testimonials Graphic Featuring Positive Reviews
Dynamic Financial Chart with Rising Trends and Urban Background
Performance Growth Chart with Positive Feedback Symbol
Customer Testimonial Graphic for Business Growth
Results Infographic Highlighting Winning Strategies
Performance Gauge Icon with Bold Typography
Customer Testimonials Social Media Post with Engaging Visuals
Illustrative Graphic on Growth Metrics and Financial Trends
Customer Testimonial Graphic Featuring Positive Reviews
Testimonial Social Media Post with User Feedback
Customer Testimonials Graphic Highlighting Satisfaction
Customer Testimonials Graphic Featuring Positive Reviews
Customer Feedback Illustration with Smartphone and Reviews
Customer Testimonials Display with Star Ratings
Performance Rating Graphic with Star Metrics
Performance Indicator Graphic with Gauge and Thumbs Up
Satisfaction Guarantee Promotional Graphic
Performance Meter Graphic with Bold Typography
Testimonial Graphic Featuring Video Playback with Positive Reviews
Performance Gauge Graphic with Indicator
Customer Testimonial Social Media Graphic
Graphic Representation of Customer Testimonials
Customer Testimonials Section with Smartphone Mockup
Corporate Presentation Slide Highlighting Revenue Growth
3D Character Running to Grow Your Business
Customer Testimonial Graphic with Quote Design
Customer Testimonials Graphic with Positive Feedback
Five-Star Review Graphic with Bold Typography
Performance Gauge Icon with Red and White Color Scheme
Performance Meter Graphic Indicating Efficiency Level
Graphical Representation of Rating Improvement Strategies
Performance Gauge Graphic Indicating Metrics
Customer Testimonial Social Media Post Featuring User Reviews
Business Performance Infographic with Graph and Happy Icon
Mobile E-commerce Mockup with User Ratings
Customer Feedback Illustration with Star Ratings
Business Professional Analyzing Graphs and Charts
Illustration of a Person Engaging with Analytics Growth on Mobile
Dynamic Graphic Promoting Growth and Engagement
Customer Feedback Social Media Graphic Featuring Positive Reviews
Customer Testimonial Graphic with Engaging Quotes
User Feedback Request Graphic with Star Rating System
Document Checkmark Icon for Approval
Performance Growth Chart with Positive Feedback
Email Marketing Performance Infographic Highlighting Key Metrics
Financial Growth Infographic Highlighting ROI
Stylized Graph Showing Financial Growth with Dollar Coin
Colorful Infographic Illustrating Business Performance Metrics
Modern Testimonial Showcase with Star Rating and Call to Action
Healthcare Growth Chart with Medical Elements
Growth Chart with Rising Arrow Illustration
Modern Smartphone Mockup Featuring Customer Testimonials
Professional Consulting Insights Graphic with Key Attributes
Data Analytics Illustration with Graphs and Percentages
Confident Business Presentation by a Professional Woman
Infographic on Key Business Strategies and Metrics
Comparison Infographic of Post Performance Metrics
Infographic Elements Representing Marketing Metrics and Strategies
Investment Growth Performance Graphic with Bold Typography
Customer Testimonials Graphic with Quote and User Details
Modern Press Release Graphic with News Elements
Performance Meter Graphic with Thumbs Up Icon
Professional CEO Introduction with Growth Metrics
Performance Gauge Icon with Minimalistic Design
Vibrant Blue Background for Design Projects
3D Laptop with Rising Graph and Charts on Purple Background
Customer Product Review Graphic Featuring Five Star Ratings
Infographic on Competitive Advantages in Business Strategy
Digital Shopping Cart on Smartphone Illustration
Handshake Icon Representing Agreement and Friendship
Influencer Marketing Performance Dashboard Illustration
Visual Representation of Feedback Mechanism with Hand and Thumbs Icons
Rocket Launching from Laptop in a Creative Digital Scene
Minimalist Analytics Illustration with Graphs and Data
Performance Indicator Graphic with Hand and Gauge
Close-up of a Dart Hitting a Colorful Target Board
Illustration of Interlocking Gears in Two Colors
Futuristic Rocket Launching from Laptop Screen
Digital Marketing Performance Graphic with Data Visualization
Engaging Research Summary Graphic Highlighting Key Statistic
Influencer Marketing Performance Data Visualization
Visual Representation of Charts and Data Overview
Informative Infographic on Campaign Performance Metrics
Marketing Performance Dashboard Graphic
Influencer Marketing Performance Report Graphic
Traffic Analysis Infographic with Growth Metrics
Infographic Highlighting Key Statistics on Problem Understanding
Interactive Data Dashboard Promotional Graphic
Creative Brand Redesign with Modern Elements
Informative Graphic on Key Performance Indicators (KPIs)
Internal Presentation Slide Design Example
Influencer Marketing Performance Metrics Graphic
Creative Graphic Promoting User-Focused Design Strategies
Dynamic Data Visualization for Business Process Automation
Modern Presentation Slide with Data Visualization
Modern layout design concepts
Enhance Your Business Productivity with Expert Insights and Tips
Vibrant Promotional Graphic for Video Content Engagement
Informative Graphic on Tracking Website Performance Metrics
Data Visualization of Influencer Marketing Performance Over Time
Engagement Strategy Social Media Graphic
Stylish Web Design for Data Organization
Promotional Graphic on Leveraging Social Media Influence
2023 Annual Report Brochure Design with Insights and Analytics
Visual Representation of Key Performance Indicators for Marketing
Promotional Graphic Encouraging Customer Reviews
Modern Data-Driven Marketing Design for Startups
Dynamic and Engaging Visual Design Promotion
Informative Infographic on Mobile Usage Statistics
Engaging Social Media Marketing Promotion Graphic
Promotional Graphic Featuring User-Focused Design Investment Message
Marketing and Sales Strategy Graphic with Key Points
Influencer Marketing Performance Graphic with Data Visualization
Informative Graphic on Key Performance Indicators
Bold Visual Engagement Concept Graphic
KPI Infographic for Data Visualization and Analysis
Digital KPI Comparison Graphic for Social Media Posts
Creative Graphic Promoting Fresh Ideas and Concepts
Promotional Graphic for Brand Collaboration with Call to Action
Informative Graphic on Marketing Strategies and KPIs
Promotional Graphic for Financial Analysis Video
Modern magazine layout design
Visual Communication Concept Graphic
Modern Landing Page Design with Engaging Elements
Professional Board Presentation Tips Visual Guide
Business Strategy Infographic Highlighting Key Metrics and Actions
Promotional Graphic for Non-Profit Discounts with Engaging Design
Stylish Web Design Featuring Typography & Lettering
Infographic on Employee Satisfaction and Productivity Benefits