Search
Sign In
Auto
2:3
Auto
2:3
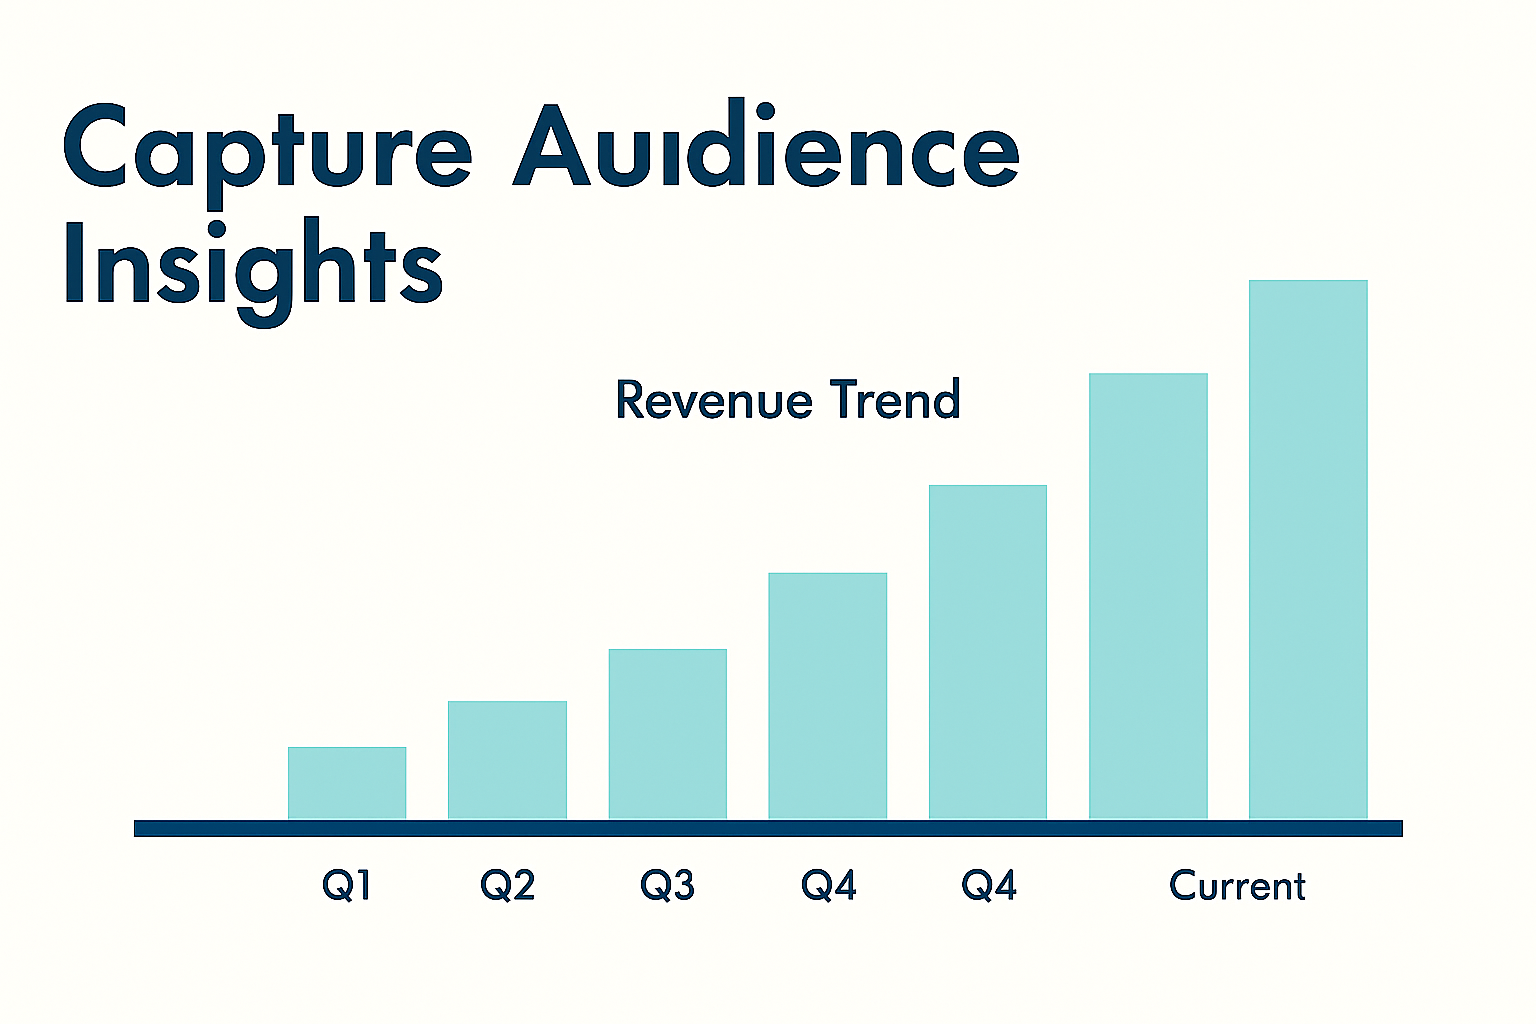
Revenue Trend Graph Illustrating Audience Insights
/
Free
/
Collection:
Base
/
by davooda
/
Type: PNG
/
Professional infographic displaying a revenue trend over four quarters plus a current metric, using a clean and modern design suitable for business presentations.
Data Visualization of User and Revenue Growth Metrics
Dynamic Landing Page Design with Engaging Elements
Infographic on Audience Analysis for Influencer Engagement
Minimalist Analytics Illustration with Graphs and Data
Stylized 3D Bar Graph Showing Growth Trend
Data Visualization for Influencer Marketing Performance
Target Audience Concept Illustration with Icons and Graphics
Modern Data Analysis Graphic with Insights Theme
Business Funding Progress Chart with Growth Analysis
Graphical Representation of Customer Needs Growth
Stylized Financial Growth Chart with Dollar Coin
Infographic on Audience Segmentation with Pie Chart
Dynamic Financial Chart with Rising Trends and Urban Background
Data Visualization of Influencer Marketing Performance Over Time
Influencer Marketing Performance Metrics Graphic
Market Growth Trends Visualization with Strategic Insights
Infographic Highlighting Key Performance Indicators (KPIs)
Modern Graph Icon Illustrating Growth and Progress
3D Laptop with Rising Graph and Charts on Purple Background
Illustration of a Person Engaging with Analytics Growth on Mobile
YouTube Analytics Visualization for Performance Tracking
Infographic on Influencer Marketing Performance Metrics
Minimalist Landing Page Design with Engaging Elements
Stylized Graph Showing Financial Growth with Dollar Coin
Launch Your Business Promotional Graphic with Growth Chart
Informative Graphic on Marketing Strategies and KPIs
User Demographics Bar Chart with Age Distribution
Healthcare Growth Chart with Medical Elements
Infographic Highlighting Startup Ideas with Market Potential
Infographic Illustrating the Customer Journey Stages
Vibrant Festival Audience Captivated by Performance
Business Professional Analyzing Graphs and Charts
Illustrative Graphic on Growth Metrics and Financial Trends
Infographic on Influencer Marketing Performance Metrics
Engaging Visual Content for Audience Attention
Modern Minimalist Landing Page Design with Search Magnifier
Business Launch Promotional Graphic with Growth Chart
Informative Graphic on Key Performance Indicators (KPIs)
Graphical Representation of Business Intelligence Concepts
Data Visualization for Influencer Marketing Performance
Content Monetization Graphic with Earnings Overview
KPI Infographic for Data Visualization and Analysis
Influencer Marketing Performance Data Visualization
Growth Chart Icons Representing Business Success
Audience Demographics Pie Chart Illustration
Modern Presentation Slide with Data Visualization Elements
Graph Displaying User Growth and Adoption Trends
Business Growth Promotion Graphic with Chart Elements
Concert Audience Analysis Infographic
Market Research Infographic Summary with Key Insights
Minimalist Landing Page Design with Search Feature
Abstract Blue Light Trails on Dark Background
3D Scene of Analytics Segment with Miniature Figures
Performance Gauge Icon with Bold Typography
Influencer Marketing Performance Analysis Graphic
Influencer Marketing Performance Report Graphic
Digital Illustration of Startup Launch Concept with Rocket and Laptop
Informative Infographic on Mobile Usage Statistics
Data Analytics Promotional Graphic with Modern Design Elements
Promotional Image for Revenue Growth Video
E-Commerce Trends Infographic with Engaging Visual Elements
Business Strategy Infographic Highlighting Key Metrics and Actions
Professional Consulting Insights Graphic with Key Attributes
Close-up of a Dart Hitting a Colorful Target Board
Infographic on Key Business Strategies and Metrics
Modern Geometric Landing Page Design with Call to Action
Stylish Web Page Mockup Featuring Amplitude Data
Business Startup Concept with Rocket Illustration
Illustrative Graphic on Target Audiences with Demographic Insights
Vibrant Graphic for Engaging Audience Attention
Corporate Strategy Presentation Slide with Sales Growth Data
Case Study Results Highlighting Key Metrics
Content Monetization Analytics Graphic
Promotional Image for Video Content Engagement
Influencer Marketing Performance Graphic with Data Visualization
Infographic Highlighting Case Study Results with Graphical Elements
Dynamic Marketing Message with Megaphone on Orange Background
Professional CEO Introduction with Growth Metrics
Financial Growth Chart with Data Visualization
Digital Marketing Performance Graphic with Data Visualization
Growth Chart with Rising Arrow Illustration
Traffic Analysis Infographic with Growth Metrics
Influencer Marketing Performance Dashboard Illustration
Dynamic Business Meeting with Team Collaboration and Strategy Planning
Informative Graphic on Marketing Strategies and KPIs
Energetic Live Rock Concert Scene with Audience Engagement
Bullseye Target with Arrow Hitting Center at Sunset
Dynamic Business Digital Graph Chart for Growth Investment
Market Analysis Graphic with Data Visualization
Infographic Illustrating Action Steps for Project Management
Stylized Financial Graph with Candlestick Chart on Blue Background
Data Analysis Concept for Sales Improvement
Engaging Audience Promotion with Heart Icons and Visual Elements
Live Concert Attendance Infographic with Statistics
Performance Meter Graphic with Bold Typography
Infographic Depicting Rocket Launch with Laptop Illustration
Conference Attendance Infographic with Key Statistics
Illustrative Graphic on Audience Engagement in Social Media
Market Analysis Graphic with Gold Brush Stroke
Performance Gauge Graphic with Bold Typography
Data Analysis Infographic for Revenue Insights
Interactive Financial Data Dashboard Promotion
Market Overview Infographic Featuring Growth Insights
Data-Driven Marketing Design for Revenue Analysis
Financial Insights Dashboard for Analysis
Professional Data Analysis Presentation Graphic
Market Research Presentation Graphic with Trend Analysis
Employee Benefits Presentation Slide with Salary Trends Graph
Professional Business Growth Strategies with Engaging Visuals
3D Bar Graph Representation of Conversion Rate Changes
Data Analysis for Startups: Enhancing Sales and Profits
Financial Investment Analysis Graphic with Trend Chart
Business Analysis Graphic Featuring Financial Review and Growth Insights
Influencer Marketing Performance Analysis Graphic
Audience Interests Infographic with Data Visualization
Professional Corporate Profile Graphic Featuring CEO Overview
Financial Growth Infographic Highlighting ROI
3D Floor Plan Illustration with Market Insights
Modern Presentation Slide with Data Visualization
Dynamic Data Visualization for Business Process Automation
Graphical Representation of Rating Improvement Strategies
Professional Data Presentation and Evaluation Graphic
3D Presentation Visual with Key Features and Graphs
Professional Financial Analyst Insights with Engaging Design
Business Analyst Reviewing Financial Statement with Graphs
Dynamic Presentation Scene with Engaging Visual Elements
Interactive Data Dashboard Promotional Graphic
Marketing Performance Dashboard Graphic
Visual Representation of Charts and Data Overview
Startup Ideas Infographic with Data Visualization
Sailboat Market Trends Infographic with Visual Elements
Business Performance Analysis Graphic with Trend Chart
2023 Annual Report Brochure Design with Insights and Analytics
Professional Financial Advisory Promotional Image
Concert Attendance Data Infographic with Visual Statistics
Financial Dashboard Visualization with Data Insights
Dynamic Business Analytics Graphic with Economic Charts
Content Quality Improvement Graphic with Magnifying Glass
Professional Business Presentation with Engaging Visuals
Modern Data-Driven Marketing Design for Startups
Conceptual Graphic for Content Monetization Tracking
Detailed 3D Illustration of Data Visualization
Illustration of Channel Analytics with Trend Graph
Business Audit Infographic for Financial Strategy Insights
Excel Data Analysis Promotion with Magnifying Glass
Promotional Graphic for Financial Analysis Video
Business Training Presentation with Engaging Speaker
Modern Data Visualization Graphic with Bar Chart and Engaging Design
Internal Presentation Slide Design Example
Infographic Highlighting America's Football Culture and Revenue