Search
Sign In
Auto
2:3
Auto
2:3
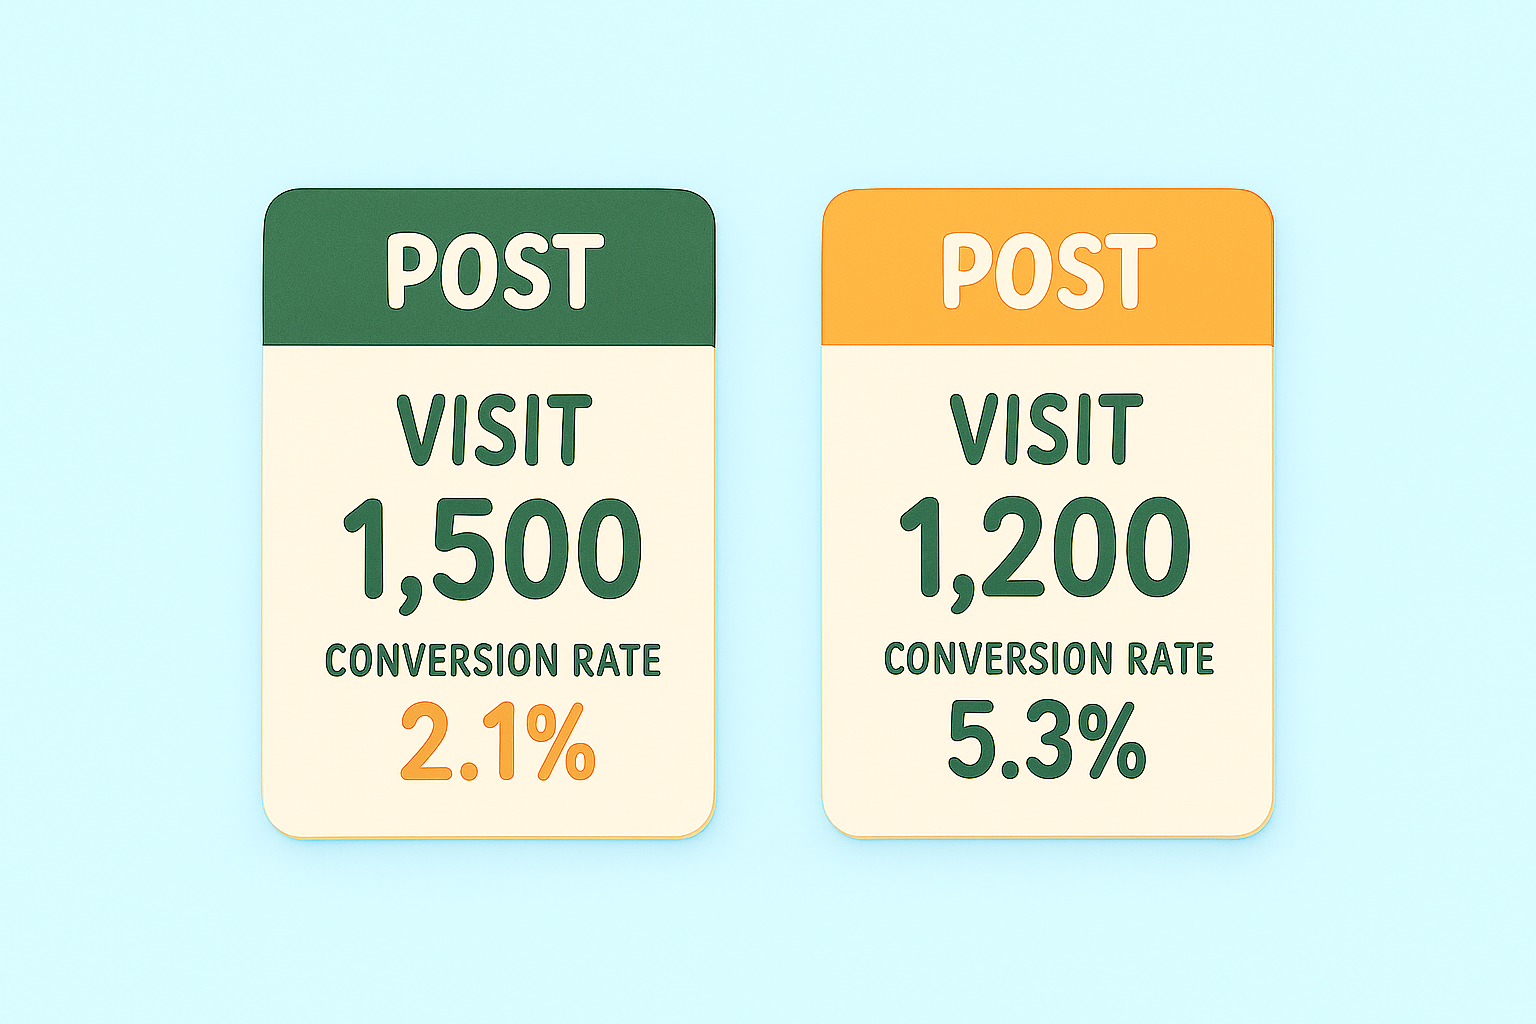
Comparison Infographic of Post Performance Metrics
/
Free
/
Collection:
Let's Present
/
by davooda
/
Type: PNG
/
Informative infographic displaying metrics for two posts, focusing on visits and conversion rates. Ideal for social media performance analysis.
KPI Comparison Graphic with Smartphone Illustrations
3D Infographic on Conversion Rate Calculation
KPI Performance Metrics Graphic for Business Analysis
Digital KPI Comparison Graphic for Social Media Posts
Marketing Performance Dashboard Graphic
Visual Representation of Social Media Engagement Metrics
Informative Graphic on Post KPIs and Performance Measurement
Stylized 3D Bar Graph Showing Growth Trend
Social Media Post KPI Comparison Graphic
Infographic Highlighting Key Performance Indicators (KPIs)
KPI Post Comparison Graphic with Illustrated Tablets
3D Bar Graph Representation of Conversion Rate Changes
Informative Graphic on Key Performance Indicators (KPIs)
Infographic Displaying KPI Progress Metrics with Visual Elements
Stylized Graphic Representing Key Performance Indicators
Informative Graphic on Key Performance Indicators (KPIs)
Stylized Graph Showing Financial Growth with Dollar Coin
KPI Infographic with Performance Metrics and Graphs
Informative Graphic on KPI Posts and Lead Generation
3D Laptop with Rising Graph and Charts on Purple Background
Stylized Financial Growth Chart with Dollar Coin
Infographic on SEO Strategies with Action Plan Elements
Informational Graphic on Web Metrics and Strategies
Informative KPI Graphic for Business Metrics
Dynamic Goal Tracker Board with 3D Elements and Gradient Background
Data Visualization of User and Revenue Growth Metrics
Minimalist Analytics Illustration with Graphs and Data
Informative Graphic on Marketing Strategies and KPIs
Healthcare Growth Chart with Medical Elements
KPI Infographic for Data Visualization and Analysis
Informative Graphic on Marketing Strategies and KPIs
Colorful Infographic Representing KPI and Action Plan Concepts
Stylish Blue Background with Geometric Shapes and Icons
Modern Workspace with Computer and Smartphone
Informative Infographic on Business Strategies and Metrics
Professional Accountant Analyzing Data with Laptop and Calculator
Statistical Graphic Highlighting Legal Service Importance
Infographic Highlighting Case Study Results with Graphical Elements
Growth Chart with Rising Arrow Illustration
Informative Graphic on KPI Metrics for Performance Evaluation
Infographic Elements Representing Marketing Metrics and Strategies
Illustrative Graphic on Return on Investment Concepts
Visual Representation of Key Performance Indicators for Marketing
Modern Graph Icon Illustrating Growth and Progress
Positive Growth Indicator with Thumbs Up Symbol
Modern Data Visualization Graphics on Transparent Panels
Colorful Directional Signage Stock Footage
Performance Metrics Infographic with Key Indicators
Illustrative Graphic on Growth Metrics and Financial Trends
Creative Illustration on Content Monetization Strategies
Growth Chart Icons Representing Business Success
Dynamic Financial Chart with Rising Trends and Urban Background
Modern Information Design: Data Usage Visualization
Stylized Growth Chart with Shield Icon for Business Insights
Stylized Digital Workspace with Orange Accents and Checklists
Informative Graphic on Business Strategies and Metrics
Glowing 3D Icon of Dollar Sign with Cash and Coins
Business Strategy Infographic Highlighting Key Metrics and Actions
Informative Graphic on Key Performance Indicators (KPIs)
Business Professional Analyzing Graphs and Charts
Stylized Financial Graph with Candlestick Chart on Blue Background
Infographic on Marketing Strategies with Visual Icons
Illustrative Infographic on Key Performance Indicators (KPI)
Stylized Blue Megaphone on Background
Informative Graphic on Marketing Strategies and KPIs
Case Study Results Visual with Graphs and Statistics
Dynamic Growth Chart with Neon Effect
Modern KPI Dashboard Displaying Performance Metrics
3D Illustration of Conversion Funnel Concept
Financial Growth Concept with Bank and Arrow Illustration
Colorful Communication Icons on Screens
Handshake Icon Representing Agreement and Friendship
Illustration of a Professional Counseling Session
Infographic on Key Business Strategies and Metrics
Stylized 3D Icon of a Deadlift in Soft Glow
Data Analytics Illustration with Graphs and Percentages
Colorful Infographic Illustrating Business Performance Metrics
Dynamic Landing Page Design with 3D Elements
Close-up of a Dart Hitting a Colorful Target Board
Colorful Computer Screen with Code and Keyboard in 3D
Golden Coin with Indian Rupee Symbol on Growth Chart Background
Performance Gauge Icon with Bold Typography
Engaging Blog Landing Page Design with 3D Elements
Illustrative Graphic on Content Monetization Strategies
E-commerce Marketing Infographic with Key Concepts
Vibrant Social Media Marketing Promotional Graphic
Soft Light and Shadows in a 3D Icon Composition
Bullseye Target with Arrow Hitting Center at Sunset
Vibrant Blue Background for Design Projects
Modern Information Design for Data Usage Monitoring
Minimalist Target with Arrow Illustration
Global Network and Security Concept with Earth and Shield
3D Illustration of Website Traffic Concept with Growth Graph
Colorful map with location pins for navigation
Bento Style Landing Page Design for Marketing
Colorful Speech Bubbles in Purple and White
Creative Graphic on Hashtag Content Strategy
Colorful Calendar Icons for Planning and Organization
Content Monetization Graphic with Earnings Overview
Close-up of a Dartboard with an Arrow Hitting the Center
Informative Infographic on Campaign Performance Metrics
Influencer Marketing Performance Data Visualization
Influencer Marketing Performance Report Graphic
Influencer Marketing Performance Metrics Graphic
Data Visualization of Influencer Marketing Performance Over Time
Data Visualization for Influencer Marketing Performance
Informative Graphic on Tracking Website Performance Metrics
Case Study Results Highlighting Key Metrics
Infographic on Social Media Validation Trends
Informative Graphic on Social Media Algorithms for Engagement
Informative Graphic on Key Performance Indicators
Infographic on the Impact of Social Media Influencers
Email Marketing Performance Infographic Highlighting Key Metrics
Infographic on Employee Satisfaction and Productivity Benefits
Informative Graphic on Key Performance Indicators and Action Plans
Digital Engagement Metrics Visualization with Energy Bars
Visual Representation of Social Media Engagement Metrics
Engagement Strategy Social Media Graphic
Informative Graphic on Social Media Engagement
Engaging Digital Marketing Infographic on Call to Action Strategies
Professional Board Presentation Tips Visual Guide
Infographic Highlighting Key Statistics on Problem Understanding
Informative Comparison Infographic for Product Decisions
Informative Infographic on Mobile Usage Statistics
Infographic on Influencer Marketing Performance Metrics
Live Concert Attendance Infographic with Statistics
Engaging Research Summary Graphic Highlighting Key Statistic
Informative Graphic on Solar Panel Installation Benefits
Data Visualization for Influencer Marketing Performance
Infographic on Influencer Marketing Strategies
Informative Graphic on Trends for Viral Video Content
Promotional Graphic for Social Media Verification Benefits
Informative Graphic on Influencer Marketing Strategies
Influencer Marketing Performance Analysis Graphic
Concert Stage Overview Infographic with Audience Metrics
Infographic on Network Server Performance Metrics
Infographic Highlighting Dog Ownership Statistics
Customer Testimonial Graphic for Business Growth
Social Media Engagement Promotion Graphic
Interactive Social Media Engagement Graphic
Engaging Social Media Post on Alerts and Notifications
Informative Graphic on AI Integration and Key Performance Indicators
Traffic Analysis Infographic with Growth Metrics
Infographic on Social Media Usage by Age Group
Informative Graphic on Cybersecurity Metrics and Strategies
Social Media Engagement Tip Graphic with Illustrated Elements
Content Monetization Analytics Graphic
Infographic on Pickleball Participation and Growth Statistics
Content Planning Infographic with Calendar and Flowchart
Visual Representation of Charts and Data Overview