Search
Sign In
2:3
2:3
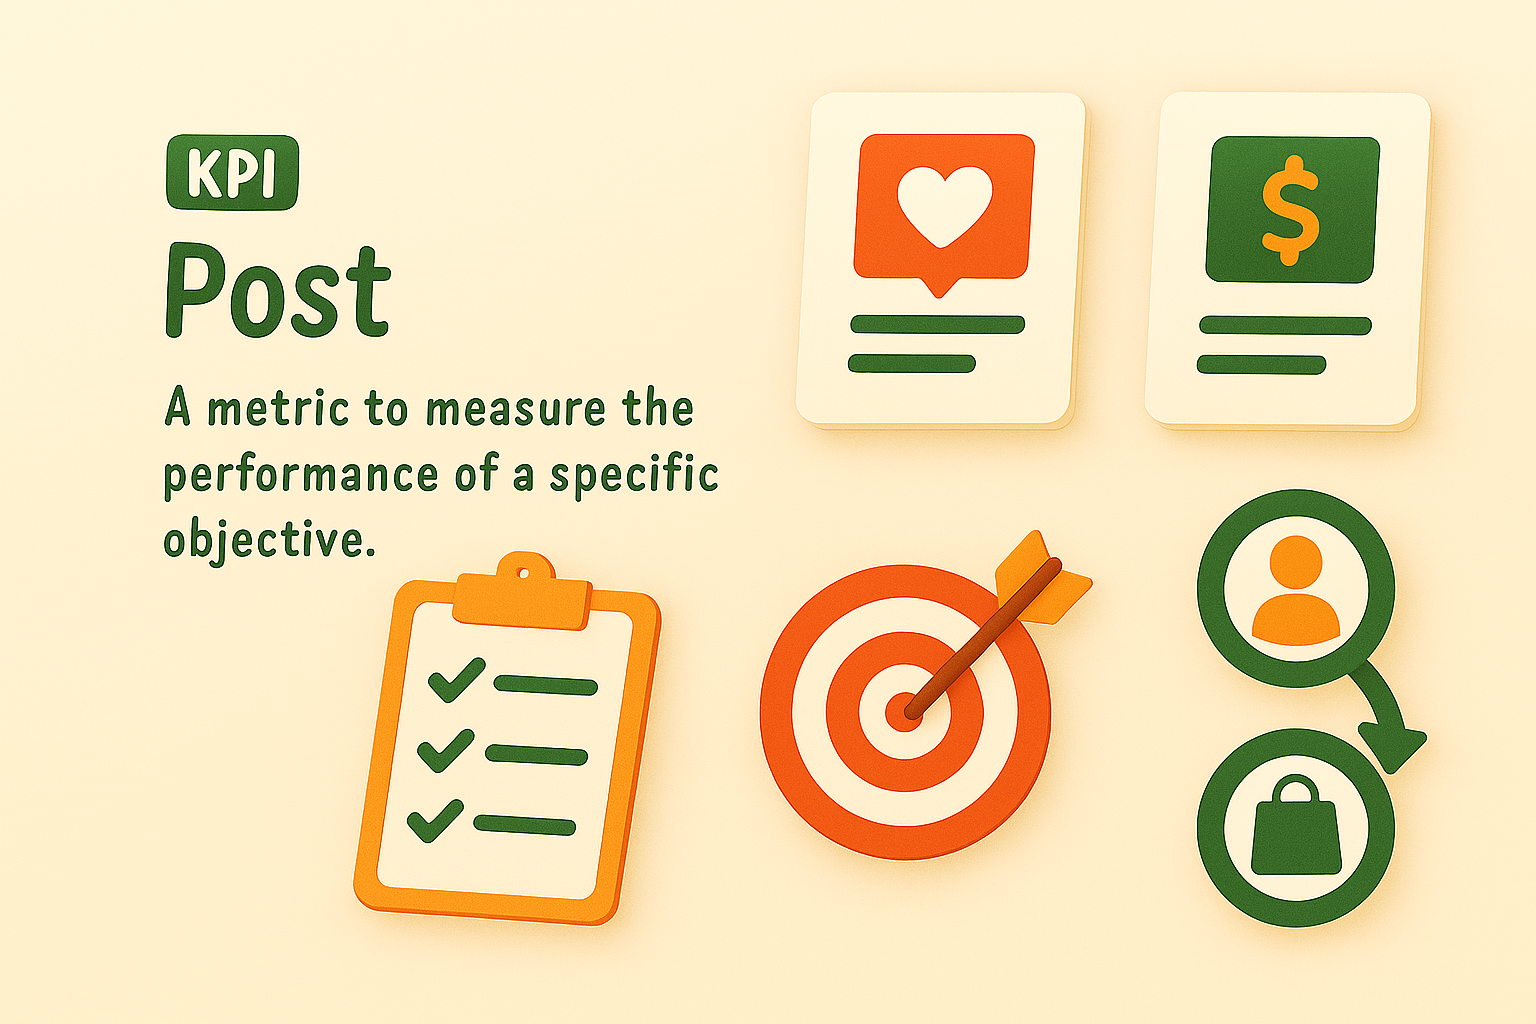
Informative Graphic on KPI Metrics for Performance Evaluation
/
Collection:
Let's Present
/
by davooda
/
Type: PNG
/
A visually appealing infographic illustrating KPIs with icons and simple text, ideal for educational or business presentations on performance metrics.
Informative Graphic on Post KPIs and Performance Measurement
Informative Graphic on Key Performance Indicators (KPIs)
KPI Comparison Graphic with Smartphone Illustrations
Informative KPI Graphic for Business Metrics
Social Media Post KPI Comparison Graphic
Illustrative Infographic on Key Performance Indicators (KPI)
Stylized Graphic Representing Key Performance Indicators
Infographic Highlighting Key Performance Indicators (KPIs)
Marketing Performance Dashboard Graphic
KPI Performance Metrics Graphic for Business Analysis
Informative Graphic on Key Performance Indicators
Digital KPI Comparison Graphic for Social Media Posts
Informative Graphic on Key Performance Indicators (KPIs)
Visual Representation of Social Media Engagement Metrics
KPI Post Comparison Graphic with Illustrated Tablets
Informative Graphic on KPI Posts and Lead Generation
Informative Graphic Representing Business KPIs and Marketing Strategies
Colorful Infographic Representing KPI and Action Plan Concepts
Infographic Displaying KPI Progress Metrics with Visual Elements
Informative Graphic on Marketing Strategies and KPIs
Colorful Infographic Illustrating Business Performance Metrics
Informative Graphic on Marketing Strategies and KPIs
Infographic on Key Business Strategies and Metrics
KPI Infographic for Data Visualization and Analysis
Business Strategy Infographic Highlighting Key Metrics and Actions
Colorful Infographic on Marketing Concepts and Strategies
Informative Graphic on Marketing Strategies and KPIs
Informative Graphic on Cybersecurity Metrics and Strategies
Informative Graphic on Key Performance Indicators and Action Plans
KPI Infographic with Performance Metrics and Graphs
Comparison Infographic of Post Performance Metrics
Informative Graphic on Business Strategies and Metrics
Infographic on SEO Strategies with Action Plan Elements
E-commerce Marketing Infographic with Key Concepts
3D Web Design with Key Metrics Visualization
Visual Representation of Key Performance Indicators for Marketing
Illustrative Graphic on Return on Investment Concepts
Illustrative Diagram for Cybersecurity Planning and Metrics
Informative Graphic on Tracking Website Performance Metrics
Infographic on Marketing Strategies with Visual Icons
Informative Graphic on Key Performance Indicators (KPIs)
3D Illustration of a Target with Goal Description Card
Informative Infographic on Business Strategies and Metrics
Performance Meter Graphic with Thumbs Up Icon
Informative Infographic on Campaign Performance Metrics
3D Web Design Illustration Focusing on Performance Metrics
3D Icon Representing OKR Framework with Target and Graph
Informational Graphic on Web Metrics and Strategies
3D Bar Chart with Heart Icon for Data Visualization
Infographic Elements Representing Marketing Metrics and Strategies
YouTube Analytics Visualization for Performance Tracking
Performance Measurement Graphic with Gauge Illustration
Performance Growth Chart with Positive Feedback Symbol
Creative Graphic on Hashtag Content Strategy
Performance Meter Graphic with Bold Typography
Illustrative Graphic on Influencer Marketing Analytics
Performance Gauge Illustration with Clear Indicators
Performance Gauge Graphic with Bold Typography
3D Bar Chart Icon with Magnifying Glass in Isometric View
Business Performance Infographic with Graph and Happy Icon
Illustrative Graphic on Growth Metrics and Financial Trends
Illustrative Graphic on Audience Engagement in Social Media
Performance Meter Graphic Illustrating Measurement Concept
Pathway to Success: 3D Mountain Illustration with Performance Tracking
Performance Gauge Graphic with Engaging Visual Elements
Performance Gauge Icon with Bold Typography
Dynamic Goal Tracker Board with 3D Elements and Gradient Background
Performance Meter Graphic Indicating Efficiency Level
Stylish 3D Limit-Order Icon with Graph and Checkmarks
Performance Gauge Graphic with Indicator
3D Social Media Marketing Icon with Graph and Megaphone
Influencer Marketing Performance Report Graphic
3D Icon of a Growth Chart on Clipboard
3D Bar Chart Icon Representing Growth Metrics
Data Visualization of User and Revenue Growth Metrics
Performance Gauge Icon with Minimalistic Design
Infographic on Influencer Marketing Performance Metrics
Dynamic Business Meeting with Team Collaboration and Strategy Planning
Stylized Bar Chart Illustration for Data Visualization
3D Illustration of Social Media Targeting Concept
3D Design Illustration for Web Page Feature Blocks
Digital Marketing Concept with Audience Targeting Graphics
Infographic on Influencer Marketing Performance Metrics
Performance Gauge Graphic Indicating Metrics
3D Social Media Marketing Icon with Isometric Design
3D Hand Holding Bar Graph with Upward Trend Arrow
User Engagement Concept Illustration with Social Media Icons
3D Red Arrow Icon Illustrating Marketing Performance Metrics
3D Magnifying Glass Over Graph Icon for Data Analysis
Performance Indicator Graphic with Gauge and Thumbs Up
3D Bar Chart Illustration Representing Growth
Stylish 3D Data Analytics Icon in Isometric View
3D Illustration of a Data Analysis Monitor with Graph
Stylized Bar Graph with Upward Trend
3D Render of a Presentation Board with Pie Chart
3D Bar Graph Illustration Representing Growth
Social Media Optimization Concept with Search Elements
Performance Indicator Graphic with Hand and Gauge
Performance Gauge Icon with Red and White Color Scheme
Performance Metrics Infographic with Key Indicators
Email Marketing Performance Infographic Highlighting Key Metrics
Infographic on Key Elements of Innovation
Informative Graphic on AI Integration and Key Performance Indicators
Influencer Marketing Performance Metrics Graphic
Customer Reviews Infographic Highlighting Company Benefits
Neighborhood Features Infographic with Icons and Text
Results Infographic Highlighting Winning Strategies
Cloud Computing Infographic with Visual Elements
Infographic on Network Server Performance Metrics
Infographic Highlighting Case Study Results with Graphical Elements
Professional Data Presentation and Evaluation Graphic
Informative Graphic on Social Media Engagement
Infographic on Competitive Advantages in Business Strategy