Search
Sign In
Auto
2:3
Auto
2:3
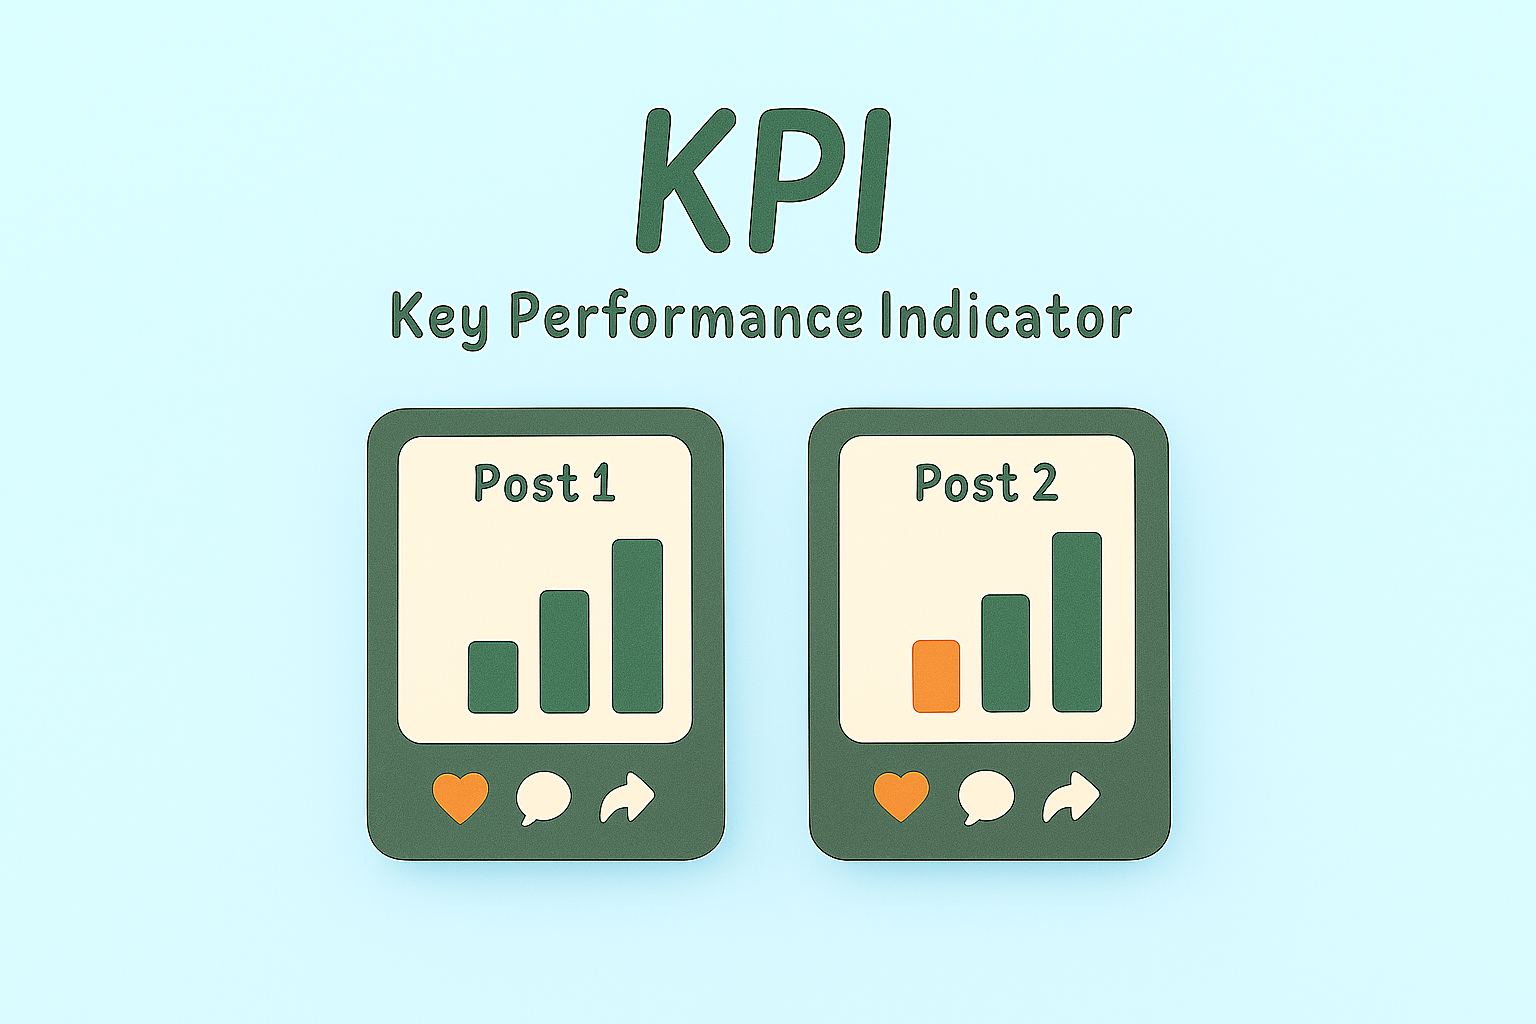
Stylized Graphic Representing Key Performance Indicators
/
Free
/
Collection:
Let's Present
/
by davooda
/
Type: PNG
/
Illustrative graphic showcasing two posts with performance metrics, designed for analytics discussions. The minimalistic style makes it suitable for presentations or social media.
Social Media Post KPI Comparison Graphic
KPI Infographic with Performance Metrics and Graphs
KPI Performance Metrics Graphic for Business Analysis
Digital KPI Comparison Graphic for Social Media Posts
KPI Post Comparison Graphic with Illustrated Tablets
Informative Graphic on Key Performance Indicators
Informative Graphic on Post KPIs and Performance Measurement
KPI Comparison Graphic with Smartphone Illustrations
Visual Representation of Social Media Engagement Metrics
Infographic Highlighting Key Performance Indicators (KPIs)
Informative Graphic on Key Performance Indicators (KPIs)
Informative Graphic on KPI Metrics for Performance Evaluation
Illustrative Infographic on Key Performance Indicators (KPI)
Informative Graphic on Key Performance Indicators (KPIs)
Marketing Performance Dashboard Graphic
Visual Representation of Key Performance Indicators for Marketing
Informative Graphic on KPI Posts and Lead Generation
Infographic Displaying KPI Progress Metrics with Visual Elements
Comparison Infographic of Post Performance Metrics
Informative KPI Graphic for Business Metrics
KPI Infographic for Data Visualization and Analysis
Infographic on Influencer Marketing Performance Metrics
Informative Graphic on Marketing Strategies and KPIs
Performance Metrics Infographic with Key Indicators
Informative Graphic on Marketing Strategies and KPIs
Informative Graphic on Marketing Strategies and KPIs
Informative Graphic on Key Performance Indicators and Action Plans
Business Performance Infographic with Graph and Happy Icon
Colorful Infographic on Marketing Concepts and Strategies
Colorful Infographic Representing KPI and Action Plan Concepts
Illustrative Graphic on Influencer Marketing Analytics
Influencer Marketing Performance Dashboard Illustration
Colorful Infographic Illustrating Business Performance Metrics
Infographic on Influencer Marketing Performance Metrics
Performance Gauge Graphic Indicating Metrics
Performance Growth Chart with Positive Feedback Symbol
Digital Marketing Performance Graphic with Data Visualization
Modern KPI Dashboard Displaying Performance Metrics
Informative Graphic Representing Business KPIs and Marketing Strategies
Influencer Marketing Performance Analysis Graphic
Performance Meter Graphic with Thumbs Up Icon
Influencer Marketing Performance Graphic with Data Visualization
Smartphone with Social Media Reactions in a Modern Office
Data Visualization for Influencer Marketing Performance
Performance Gauge Graphic with Bold Typography
Stylish Blue Background with Geometric Shapes and Icons
Informative Graphic on Tracking Website Performance Metrics
Business Strategy Infographic Highlighting Key Metrics and Actions
Infographic on Key Business Strategies and Metrics
Performance Meter Graphic with Bold Typography
Performance Gauge Graphic with Engaging Visual Elements
Illustrative Diagram for Cybersecurity Planning and Metrics
Influencer Marketing Performance Analysis Graphic
Stylized 3D Bar Graph Showing Growth Trend
Social Media Optimization Concept with Search Elements
Performance Gauge Graphic with Indicator
Performance Gauge Icon with Minimalistic Design
Performance Meter Graphic Indicating Efficiency Level
Performance Gauge Icon with Bold Typography
Influencer Marketing Performance Report Graphic
Illustration of User Interaction with Mobile App
Performance Gauge Graphic with Hand Interaction
Infographic on SEO Strategies with Action Plan Elements
Positive Growth Indicator with Thumbs Up Symbol
Data Visualization for Influencer Marketing Performance
3D Web Design with Key Metrics Visualization
Performance Gauge Illustration with Clear Indicators
Performance Meter Graphic Illustrating Measurement Concept
Informative Graphic on Key Performance Indicators (KPIs)
Informative Graphic on Business Strategies and Metrics
Creative Graphic on Hashtag Content Strategy
Graphical Representation of Performance Metrics with Bold Typography
Illustrative Graphic on Influencer Verification Benefits
Informative Graphic on Cybersecurity Metrics and Strategies
Performance Meter Graphic with Hand Interaction
Illustrative Graphic on Audience Engagement in Social Media
Performance Growth Chart with Positive Feedback
Performance Indicator Graphic with Hand and Gauge
Performance Gauge Graphic with Bold Typography
Performance Gauge Icon with Red and White Color Scheme
Dynamic Goal Tracker Board with 3D Elements and Gradient Background
Data Visualization of Influencer Marketing Performance Over Time
User Engagement Concept Illustration with Social Media Icons
Influencer Marketing Performance Analysis Graphic
Minimalist Analytics Illustration with Graphs and Data
Performance Indicator Graphic with Gauge and Thumbs Up
Data Visualization of User and Revenue Growth Metrics
Informative Infographic on Business Strategies and Metrics
Healthcare Growth Chart with Medical Elements
Handshake Icon Representing Agreement and Friendship
YouTube Analytics Visualization for Performance Tracking
Informative Infographic on Campaign Performance Metrics
Influencer Marketing Performance Metrics Graphic
Infographic on Marketing Strategies with Visual Icons
Illustration of a Woman Engaged with a Smartphone in Bed
3D Laptop with Rising Graph and Charts on Purple Background
Modern Data Visualization Graphics on Transparent Panels
Stylized Graph Showing Financial Growth with Dollar Coin
Performance Meter Graphic Indicating High Performance Level
Infographic Elements Representing Marketing Metrics and Strategies
Graphical Representation of Rating Improvement Strategies
Influencer Marketing Performance Data Visualization
Content Monetization Analytics Graphic
Goal Tracking Illustration with Growth Metrics
Visual Representation of Social Media Engagement Metrics
Performance Measurement Graphic with Gauge Illustration
Professional Data Presentation and Evaluation Graphic
Performance Indicator Graphic with Positive Feedback
Case Study Results Highlighting Key Metrics
Data Analytics Illustration with Graphs and Percentages
3D Presentation Visual with Key Features and Graphs
Visual Representation of Charts and Data Overview
Dynamic Graphic Promoting Growth and Engagement
Digital Engagement Metrics Visualization with Energy Bars
Professional Growth Achievement Graphic with Progress Bar
Modern Data Analysis Graphic with Insights Theme
Infographic on Software Development Metrics with Illustrative Style
Performance Indicator Graphic with Positive Feedback
Traffic Analysis Infographic with Growth Metrics
Dynamic Presentation Scene with Engaging Visual Elements
Modern Graphic Highlighting User Ratings with Bar Graph
Promotional Graphic for Solar Energy Benefits
Content Quality Improvement Graphic with Magnifying Glass
Infographic Highlighting Case Study Results with Graphical Elements
Detailed 3D Illustration Showcasing Results and Growth
Infographic on Network Server Performance Metrics
Social Media Engagement Promotion Graphic
Engaging Research Summary Graphic Highlighting Key Statistic
Market Analysis Graphic with Data Visualization
Achievement Recognition Graphic Featuring Success Metrics
Engaging Social Media Post on Alerts and Notifications
Illustrative Graphic Representing Research and Development Progress
Productivity Tips Graphic for Modern Office Environment
3D Web Design Illustration Focusing on Performance Metrics
Promotional Graphic for Academic Success and Report Card Improvement
Email Marketing Performance Infographic Highlighting Key Metrics
Infographic Design Highlighting Efficiency Metrics
Influencer Marketing Performance Graphic with Engaging Visuals
Graphical Representation of Customer Needs Growth
Investment Management Graphic with Modern Design
Customer Satisfaction Promotion Graphic with Engaging Metrics
Stylized Report Card Graphic for Academic Success
Modern Presentation Slide with Data Visualization
Promotional Graphic for Solar Panel Installation Benefits
Professional Presentation Slide on Internal Communication Metrics
Engagement Strategy Social Media Graphic
Financial Dashboard Visualization with Data Insights
Promotional Graphic on Energy Efficiency and Sustainability
Artistic Showcase Display with Viewer Metrics and Curated Selection
Infographic on Employee Satisfaction and Productivity Benefits