Search
Sign In
Auto
2:3
Auto
2:3
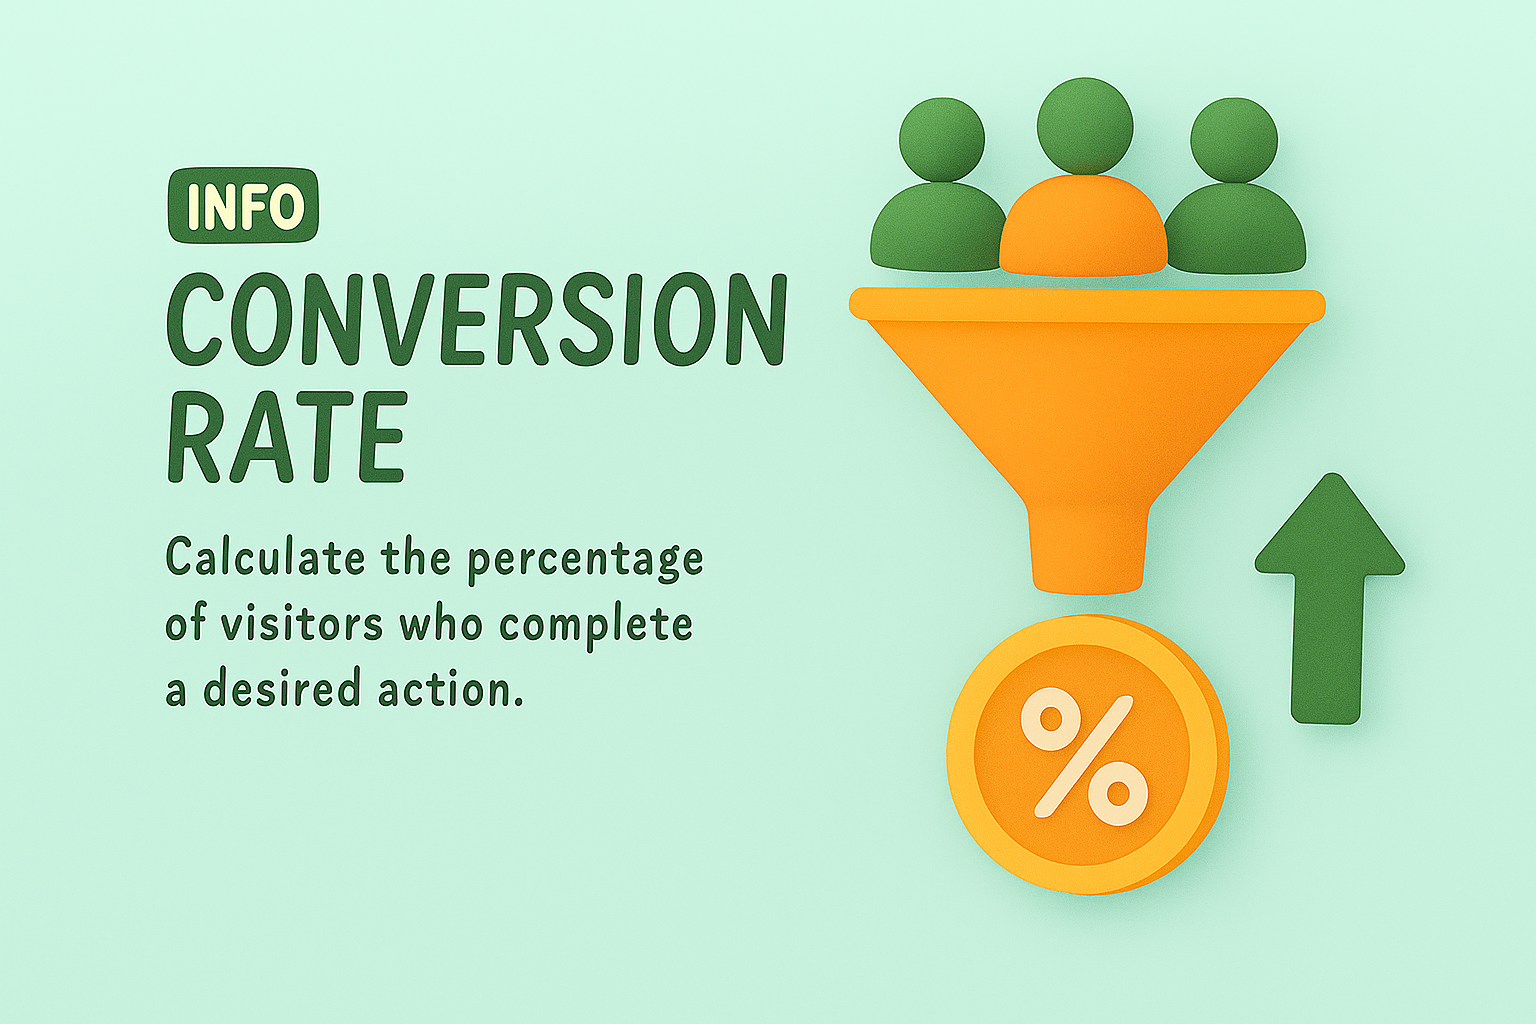
3D Infographic on Conversion Rate Calculation
/
Free
/
Collection:
Let's Present
/
by davooda
/
Type: PNG
/
Informative 3D infographic illustrating the concept of conversion rates with engaging visuals. Ideal for educational content in marketing and analytics.
3D Illustration of Conversion Funnel Concept
Comparison Infographic of Post Performance Metrics
Informational Graphic on Web Metrics and Strategies
Infographic Displaying KPI Progress Metrics with Visual Elements
Informative Infographic on Business Strategies and Metrics
Sales Funnel Infographic Illustrating Customer Journey
Informative Graphic on Key Performance Indicators (KPIs)
Performance Metrics Infographic with Key Indicators
Colorful Infographic Design Illustrating Data Visualization Concepts
Informative Graphic on Business Strategies and Metrics
Informative KPI Graphic for Business Metrics
Informative Graphic on Key Performance Indicators (KPIs)
3D Call-to-Action Button Illustration
Colorful Infographic Representing KPI and Action Plan Concepts
E-commerce Marketing Infographic with Key Concepts
Informative Graphic on Key Performance Indicators (KPIs)
Infographic Elements Representing Marketing Metrics and Strategies
Engaging Digital Marketing Infographic on Call to Action Strategies
Informative Graphic on KPI Posts and Lead Generation
3D Illustration on Content Marketing Strategy
Colorful Infographic Illustrating Business Performance Metrics
Lead Generation Concept Graphic with Funnel and Icons
Informative Graphic on Marketing Strategies and KPIs
3D Bar Graph Representation of Conversion Rate Changes
Statistical Graphic Highlighting Legal Service Importance
Colorful Infographic Design with Data Visualization Elements
Infographic on Marketing Strategies with Visual Icons
Colorful Infographic on Marketing Concepts and Strategies
Infographic on Key Business Strategies and Metrics
Informative Graphic Representing Business KPIs and Marketing Strategies
Informative Graphic on Post KPIs and Performance Measurement
Informative Graphic on Marketing Strategies and KPIs
Infographic Highlighting Key Performance Indicators (KPIs)
User Engagement Concept Illustration with Social Media Icons
Colorful Informational Graphic on Marketing Concepts
Modern Information Design: Data Usage Visualization
Infographic on SEO Strategies with Action Plan Elements
Dynamic Landing Page Design with Engaging Elements
Informative Graphic on Key Performance Indicators and Action Plans
Informative Graphic on Marketing Strategies and KPIs
Visual Representation of Key Performance Indicators for Marketing
Infographic on Content Monetization Strategies
KPI Performance Metrics Graphic for Business Analysis
Professional Accountant Analyzing Data with Laptop and Calculator
KPI Infographic for Data Visualization and Analysis
Infographic on Audience Analysis for Influencer Engagement
Illustrative Action Plan Infographic for Goal Setting
Modern Bento Style Landing Page Design Concept
Email Marketing Concept Graphic with Engaging Visuals
Bento Style Landing Page Design for Marketing
Illustrative Guide for Subscription Steps with Playful Design
Stylized Travel Poster for Las Vegas Attractions
Dynamic Business Meeting with Team Collaboration and Strategy Planning
Playful Graphic on Content Creation Strategies
Infographic Illustration of the AIDA Marketing Funnel
3D Web Design Illustration Featuring Search Functionality
KPI Infographic with Performance Metrics and Graphs
3D Illustration of Sales Promotion with Description
3D Landing Page Design with Green Phone and Modern UI Elements
Modern Geometric Landing Page Design with Clean Aesthetics
Stylized Graph Showing Financial Growth with Dollar Coin
Landing Page Design with Discounts and Offers
Email Marketing Performance Infographic Highlighting Key Metrics
Business Strategy Infographic Highlighting Key Metrics and Actions
3D Illustration of Educational Content on Computer Screen
3D Web Design with Multiplier Feature Illustration
Illustrative Guide for Referral Program Implementation
User Demographics Bar Chart with Age Distribution
Graphical Representation of Customer Needs Growth
Engaging Call-to-Action Graphic with Modern Design Elements
Modern Landing Page Design in Boho Style with 3D Elements
Dynamic Goal Tracker Board with 3D Elements and Gradient Background
Detailed 3D Scene with Miniature Characters and Messaging Elements
Illustration of Buyer Persona Concept for Marketing
3D Tourist Map Illustration for Navigation and Exploration
Dynamic 3D Cashback Coupon in Red Gift Box
3D Floor Plan Visualization for Residential Design
3D Illustration of Channel Growth Metrics on a Computer Screen
Modern Travel and Tourism Landing Page Design
KPI Comparison Graphic with Smartphone Illustrations
3D Notification Design with Integrated Elements
Illustrative Infographic on Key Performance Indicators (KPI)
Dynamic Business Meeting with Team Collaboration on Strategy
Colorful Educational Graphics for Digital Marketing Concepts
Vibrant Summer Travel Landing Page Design
Botanical Illustration with Informative Elements
Illustrative Graphic on Target Audiences with Demographic Insights
Stylized 3D Bar Graph Showing Growth Trend
Dynamic Landing Page Design with 3D Elements
3D Laptop with Rising Graph and Charts on Purple Background
Modern Landing Page Mockup for Instagram Notification
Informative Graphic on Digital Marketing Strategies
3D Web Design Element for Update Notification
Soft Light and Shadows in a 3D Icon Composition
Modern Travel and Tourism Landing Page Design
3D Download Button Illustration with Dark Overlay
Graphical Representation of Performance Metrics with Bold Typography
3D Scene of Analytics Segment with Miniature Figures
Stylish Travel Landing Page Design with 3D Elements
3D Notification Illustration for Web Design
3D Web Design Concept with Hypothesis Explanation
Illustrative Graphic on Return on Investment Concepts
3D Visualization of SEO Data Analysis and Optimization Techniques
3D Illustration of Content Marketing Concept with Engaging Visuals
3D Landing Page Design with Analytics Features
Financial Growth Infographic Highlighting ROI
3D Web Page Design Featuring Growth Metrics and Features
Content Monetization Analytics Graphic
Financial Growth Infographic with Investment Insights
Dynamic 3D Webpage Illustration with Features
Infographic on BBQ Meat Consumption and Sales Trends
3D Illustration of Equation Features for Landing Page
3D Floor Plan Illustration with Market Insights
Dynamic 3D Illustration of Iranian Payroll and Financial Accounting
3D Space Shuttle Launch Illustration with Business Metrics
3D Infographic on Structured Workout Plans for Muscle Training
3D Illustration for Content Marketing Concept
Infographic on Wheat Sales Growth with Visual Elements
3D Web Design with Key Metrics Visualization
3D Powerful Calculator with Key Features Overview
Engaging Math Concepts with 3D Illustration and Features
Engaging 3D Scene of Data Analysis Workspace
3D Budgeting Web Design Concept with Feature Blocks
3D Illustration of Hypothesis Testing Concepts
Content Quality Improvement Graphic with Magnifying Glass
Dynamic 3D Illustration of Lead Generation Strategies
3D Tax Benefits Illustration with Text Description
3D Accountant Illustration with Text Elements and Action Button
3D Web Page Design Featuring Expense Tracker
Data Visualization of User and Revenue Growth Metrics
3D Web Design Tutorial Card Illustration
3D Presentation Visual with Key Features and Graphs
Traffic Analysis Infographic with Growth Metrics
3D Web Design for Office Productivity Enhancement
3D Illustration of Statistics with Visual Features
3D Web Page Design Featuring Accurate Translations
3D Illustration Landing Page Design for Effortlessly Spread Feature
3D Web Design Concept Featuring Growth Metrics
3D Illustration for Forecasting Features on a Landing Page
3D Web Page Design Featuring Productivity Tools
3D Web Design Integration with Innovative Feature Display
3D Scene of Total Calculation Interface in Dark Background
3D Web Design with Engaging Multimedia Features
3D Calculator Illustration with Feature Description
3D Graphic Design for Currency Exchange Web Page
Promotional Graphic for Video Marketing Strategies
Illustrative Guide on Increasing Subscribers for Digital Content
3D Scene of Data Analysis and SEO in Vibrant Colors
Informative Graphic on Social Media Engagement
Content Monetization Graphic with Earnings Overview