Search
Sign In
Auto
2:3
Auto
2:3
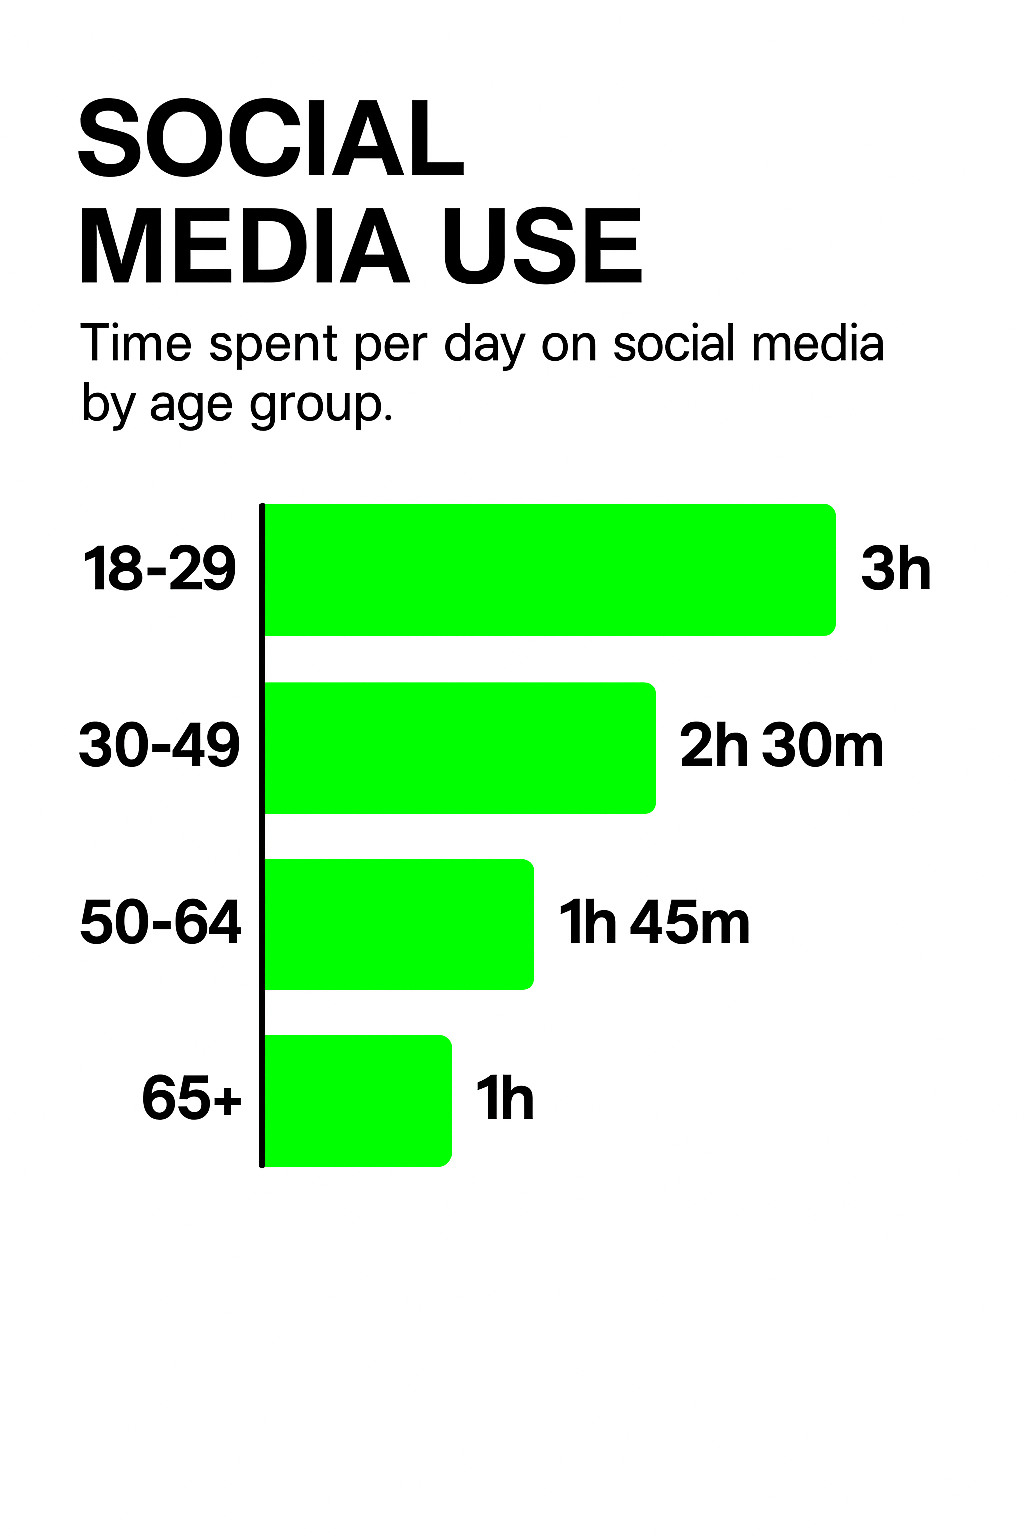
Infographic on Social Media Usage by Age Group
/
Free
/
Collection:
Basic Green
/
by davooda
/
Type: PNG
/
Simple infographic displaying time spent on social media by different age groups, using bold colors and clear typography for easy understanding.
User Demographics Bar Chart with Age Distribution
Graphic Representation of Social Media Engagement
Data Visualization of User and Revenue Growth Metrics
Infographic on Advertising Budget Distribution by Medium
Data Visualization of Influencer Marketing Performance Over Time
Vibrant Social Media Marketing Promotional Graphic
Informative Infographic on Mobile Usage Statistics
Infographic Representing Gender Follower Distribution
Colorful Social Media Engagement Illustration with Abstract Figures
Infographic on Influencer Marketing Performance Metrics
Illustration of a Young Boy Engaged in Mobile Gaming
Middle Aged Woman Engaging with Social Media on Smartphone
Infographic on Influencer Marketing Performance Metrics
Infographic on Plastic Waste and Recycling Statistics
Digital Marketing Performance Graphic with Data Visualization
Smartphone with Social Media Reactions in a Modern Office
Influencer Marketing Performance Analysis Graphic
Data Visualization for Influencer Marketing Performance
Digital Awareness Graphic on Excessive Screen Time
Audience Interests Infographic with Data Visualization
Illustration of a Person Engaging with Food on a Mobile Device
Stylized Representation of Population Segmentation
Influencer Marketing Performance Metrics Graphic
Influencer Marketing Performance Dashboard Illustration
Illustrative Graphic Promoting Earth Day Awareness
Influencer Marketing Performance Graphic with Data Visualization
Infographic on Energy Usage Reduction with Visual Statistics
Media Coverage Visual Representation with Icons and Text
Illustrative Graphic on Audience Engagement in Social Media
Influencer Marketing Performance Analysis Graphic
Digital Interaction Scene with Coffee and Smartphone
Data Visualization for Influencer Marketing Performance
Digital Health Monitoring Illustration with Heart Rate Tracking
Modern Information Design: Data Usage Visualization
Illustration of User Interaction with Mobile App
Mobile Usage Infographic with Statistics and Illustration
Illustration of a Person Engaging with Analytics Growth on Mobile
Influencer Marketing Performance Data Visualization
Senior Man Working Out in Gym for Healthy Lifestyle
Illustration of a Hand Holding a Phone with a Play Button
Illustrative Graphic for Instagram Story Engagement
Social Media Content Planning Calendar Graphic
Engaging Social Media Promotional Graphic Featuring a Young Woman
Social Media Engagement Promotion Graphic
Educational Graphic on Hashtags and Their Function
Illustration of Live Video Interaction on Mobile Device
Performance Gauge Illustration with Clear Indicators
Informative Infographic on Plastic Waste Statistics
Digital Voice Recording Concept with Smartphone and Microphone
Illustration of Online Shopping Experience with User Interaction
Minimalist Icon Graphic with Heart and Paper Plane
Illustrative Graphic of a Young Woman Engaging with Smartphone
Stylized 3D Bar Graph Showing Growth Trend
Illustrative Graphic on Social Media Addiction and Information Overload
E-Commerce Trends Infographic with Engaging Visual Elements
3D Illustration of Mobile Connectivity with Social Networks
Media Coverage Announcement Graphic with News Elements
Illustrative Guide to Measuring Noise Levels with Smartphone
Capturing a Sunset on a Smartphone
Influencer Marketing Performance Report Graphic
Engaging Digital Marketing Infographic on Call to Action Strategies
Modern Information Design for Data Usage Monitoring
Digital Illustration of a Phone Blocking Social Media Access
Illustration of a Podcaster Engaging with a Smartphone
Illustration of Online Shopping Concept with Mobile Device
Influencer Marketing Performance Analysis Graphic
Influencer Marketing Performance Graphic with Engaging Visuals
Infographic on Audience Analysis for Influencer Engagement
Social Media Follower Milestone Graphic
Infographic on Plastic Waste and Recycling Statistics
Illustration of Online Shopping Concept with Engaged User
Dynamic Marketing Message with Megaphone on Orange Background
Digital Screen Time Warning Graphic with Smartphone Illustration
Illustration of a Person Using a Phone in Bed
Illustration of a Woman Engaging with Smartphone Notifications
Children Engaged with Educational Game on Smartphone
3D Social Media Marketing Promotional Graphic
Digital Interaction Illustration in a Cozy Café Setting
Webinar Schedule Layout with Clear Time Slots
Illustration of Online Shopping with a User and Cart Icon
Fitness Tracking App Interface on Smartphone
Illustration of Voice Recording on a Smartphone
Illustration of a Podcaster Engaging with Mobile Device
Illustration of a Young Person Engaging with Social Media
Illustration of a Person Ordering Food Online
Illustration of a Podcaster Speaking with Microphone and Smartphone
Graphical Representation of Customer Needs Growth
Illustration of a Woman Engaged with a Smartphone in Bed
Child Holding a Blank Smartphone on a Wooden Surface
Social Media Engagement Graphic Highlighting Followers Concept
Infographic on Global Plastic Waste Statistics and Impact
Stylized Financial Growth Chart with Dollar Coin
Performance Meter Graphic Indicating Efficiency Level
Illustrative Graphic Representing Social Media Follower Milestone
3D Illustration of Social Media Targeting Concept
Performance Meter Graphic with Bold Typography
Illustrative Graphic on Information Overload and Social Media Addiction
Performance Gauge Graphic with Bold Typography
Performance Gauge Icon with Bold Typography
Illustrative Graphic Representing Social Media Followers Count
Infographic on the Impact of Social Media Influencers
Infographic on Social Media Validation Trends
Modern Graphic Design for Video Engagement Tips
Professional Board Presentation Tips Visual Guide
Engagement Strategy Social Media Graphic
Infographic on Coffee Consumption Benefits and Statistics
Informative Graphic on Senior Care Tips for Older Adults
Informative Graphic on Social Media Engagement
Infographic on Influencer Marketing Strategies
Promotional Graphic on Leveraging Social Media Influence
Interactive Social Media Engagement Graphic
Empowering Seniors in Technology Use with Modern Aesthetic
Informative Graphic on Social Media Algorithms for Engagement
Social Media Content Planning Graphic
Illustrative Infographic on Cocktail Consumption Trends
Engaging Social Media Post on Alerts and Notifications
Cybersecurity Best Practices Infographic for Digital Safety
Social Media Engagement Tip Graphic with Illustrated Elements
Visual Guide to the Infographic Design Process
Vibrant Promotional Graphic for Video Content Engagement
Live Concert Attendance Infographic with Statistics
Creative Graphic Promoting User-Focused Design Strategies
Stylish Kitchen Design Ideas with Modern Aesthetics
Modern magazine layout design
Productivity Tips Graphic for Modern Office Environment
Informative Pizza Consumption and Popularity Graphic
Informative Graphic on Influencer Marketing Strategies
Community Support and Kindness Infographic
Engaging Social Media Marketing Promotion Graphic
Infographic on Teenage Spending Habits in Gaming
Speed specifications infographic
Digital Engagement Infographic with Energy Bars Concept
Informative Graphic on Passport Backup Tips
Infographic on Big Data and Smart City Concepts
Concert Audience Analysis Infographic
Promotional Graphic for Video Marketing Strategies
Informative Infographic About the Sun's Characteristics
Informative Graphic on EV Charging Station for Electric Vehicles
Visual Representation of Social Media Engagement Metrics
Digital KPI Comparison Graphic for Social Media Posts
Infographic on Researching Viral Video Trends
Modern Graphic on the Importance of Visual Communication
Email Marketing Performance Infographic Highlighting Key Metrics
Time Management Tips for Increased Productivity in 20 Minutes
Promotional Social Media Marketing Graphic
Informative Graphic on Cannabis Basics and Effects
Modern Infographic on Big Data in Smart Cities
Infographic on Employee Satisfaction and Productivity Benefits
Professional Branding Tips Graphic for Personal Development
Dental Care Infographic on Healthy Smiling Practices