Search
Sign In
Auto
2:3
Auto
2:3
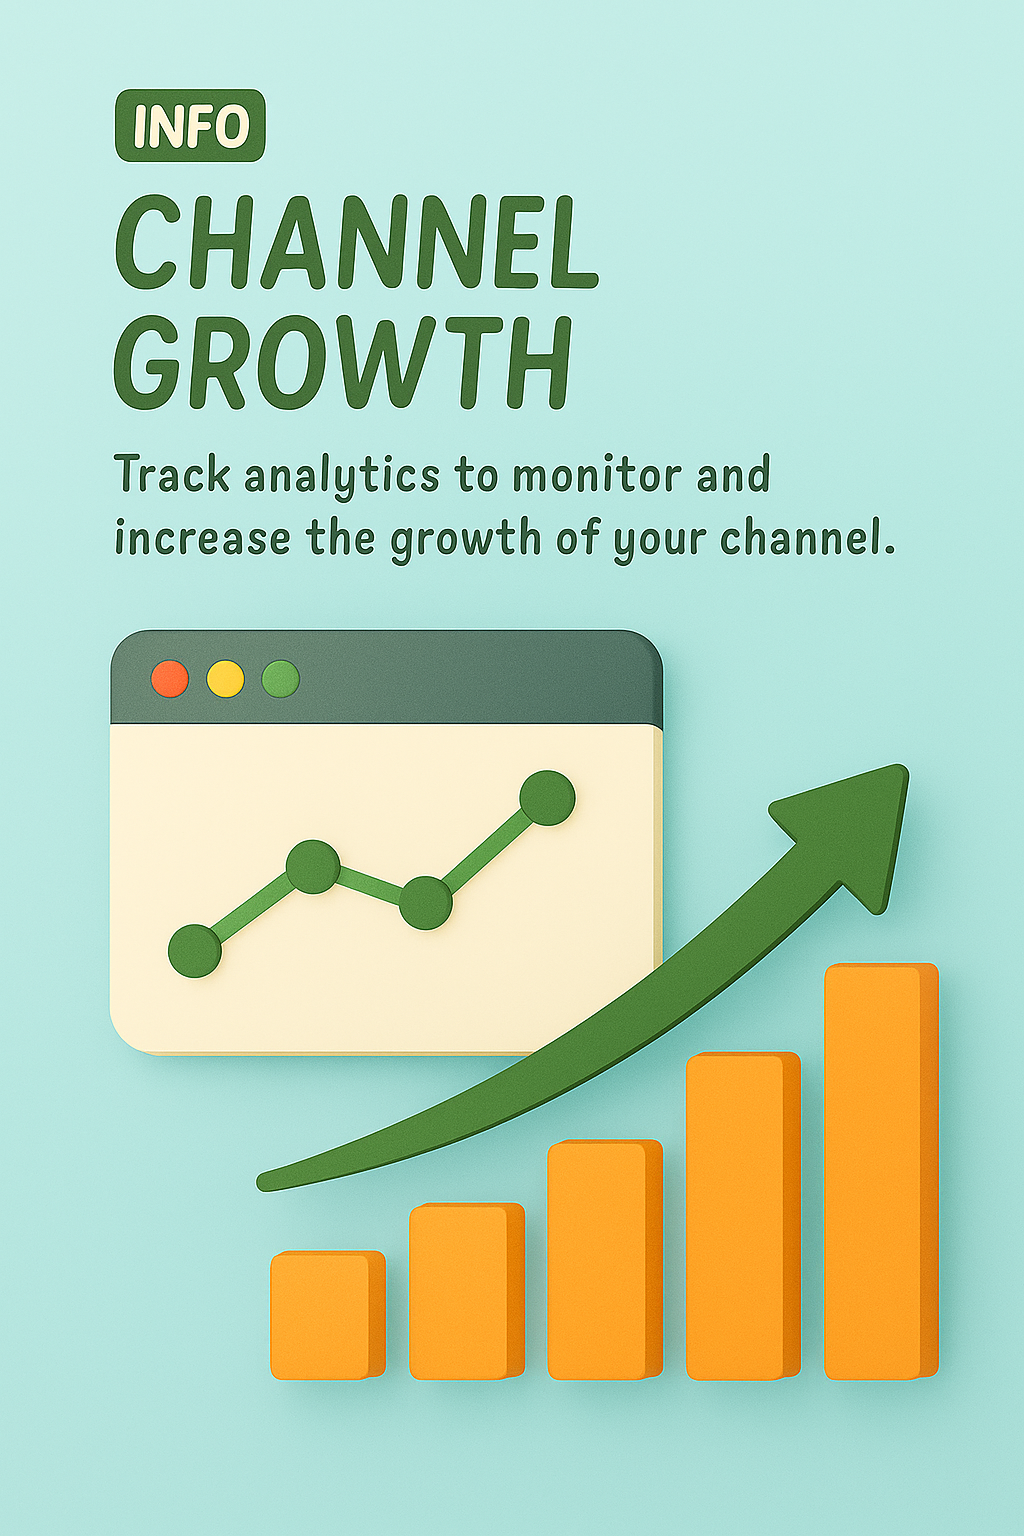
3D Illustration for Channel Growth Analytics
/
Free
/
Collection:
Let's Present
/
by davooda
/
Type: PNG
/
A visually engaging 3D illustration representing channel growth analytics, featuring a graph, an upward arrow, and vibrant colors. Ideal for digital marketing and social media content.
3D Illustration of Channel Growth Metrics on a Computer Screen
Goal Tracking Illustration with Growth Metrics
Illustration of Channel Analytics with Trend Graph
Infographic Displaying KPI Progress Metrics with Visual Elements
YouTube Analytics Visualization for Performance Tracking
Data Visualization of User and Revenue Growth Metrics
Investment Growth Infographic for Financial Analysis
Business Growth Concept Graphic with Charts and Arrow
Illustration of a Person Engaging with Analytics Growth on Mobile
Illustrative Graphic for Channel Analytics Report
3D Growth Illustration with Unique Design Elements
KPI Performance Metrics Graphic for Business Analysis
3D Visual Progress Tracker Design for Web Page
Detailed 3D Illustration of Data Visualization
Minimalist Analytics Illustration with Graphs and Data
Financial Growth Chart for Stock Market Investment
Infographic Highlighting Key Performance Indicators (KPIs)
Financial Growth Infographic with Investment Insights
3D Illustration for Data Analysis Landing Page
Landing Page Design for Marketing Strategies and Features
3D Web Design with Key Metrics Visualization
Digital Growth Concept for Video Channel Expansion
Motivational Graphic for Goal Tracking and Progress Monitoring
Detailed 3D Graph Illustration with Text Elements
Modern Information Design: Data Usage Visualization
Illustrative Graphic on Growth Metrics and Financial Trends
Business Growth Concept with Upward Arrow and Bar Chart
Informative Infographic on Business Strategies and Metrics
Data Analytics Promotional Graphic with Modern Design Elements
KPI Infographic for Data Visualization and Analysis
3D Web Design Concept Featuring Growth Metrics
Data Analytics Promotional Graphic with Modern Design
Informative Graphic on Marketing Strategies and KPIs
Informative Graphic on Tracking Website Performance Metrics
Colorful Illustration of Educational Growth Concept
3D Graph Analysis Illustration with Insights
Visual Representation of Key Performance Indicators for Marketing
Modern Data Analysis Graphic with Insights Theme
Informative Graphic on Key Performance Indicators (KPIs)
Informative Graphic on Business Strategies and Metrics
Illustrative Graphic for Business Startup Theme
3D Web Page Design Featuring Integrated Analytics Tools
Stylized 3D Bar Graph Showing Growth Trend
Professional Growth Achievement Graphic with Progress Bar
Detailed 3D Graph Illustration for Data Analysis
Dynamic Graphic Promoting Growth and Engagement
Investment Portfolio Growth Analytics Graphic
Dynamic Font for Automotive Logos in Vibrant 3D Design
Informative KPI Graphic for Business Metrics
KPI Infographic with Performance Metrics and Graphs
Modern Information Design for Data Usage Feature
Digital Data Exploration and Analytics Graphic
Informative Graphic on Key Performance Indicators (KPIs)
Dynamic Landing Page Design with 3D Elements
Modern Graph Icon Illustrating Growth and Progress
Informative Graphic on Key Performance Indicators and Action Plans
3D Laptop with Rising Graph and Charts on Purple Background
3D Illustration of Website Traffic Concept with Growth Graph
E-commerce Marketing Infographic with Key Concepts
3D Scene of Analytics Segment with Miniature Figures
Stylized Graphic Illustrating Gaming Channel Statistics
Informative Graphic on Marketing Strategies and KPIs
Healthcare Growth Chart with Medical Elements
SEO Marketing Promotion with Mobile Device Visuals
Illustrative Graphic on Influencer Marketing Analytics
Infographic on Key Business Strategies and Metrics
Detailed 3D Graph Illustration with Action Button and Text
Data Analytics Illustration with Graphs and Percentages
Modern KPI Dashboard Displaying Performance Metrics
Infographic on Content Monetization Strategies
Colorful Infographic Illustrating Business Performance Metrics
Data Analysis Concept for Sales Improvement
Infographic on SEO Strategies with Action Plan Elements
Informational Graphic on Web Metrics and Strategies
Digital Financial Chart Representing Market Growth
Digital Marketing Concept with 3D Elements
Vibrant Office Space with Natural Light and Productivity Focus
Conceptual Growth Illustration with Green Plant
3D Visualization of SEO Data Analysis and Optimization Techniques
Dynamic Business Digital Graph Chart for Growth Investment
Dynamic Financial Chart with Rising Trends and Urban Background
Dynamic Real-Time Analytics Dashboard Graphic
Infographic Elements Representing Marketing Metrics and Strategies
Business Analysis and Market Trends Visual Representation
Modern Digital Illustration for Project Launch Promotion
Dynamic Growth Chart with Neon Effect
Minimalist 3D Scene of a Growing Plant on Dark Background
Data Visualization for Influencer Marketing Performance
Financial Growth Chart Graphic for Investment Trading
3D Bar Graph Representation of Conversion Rate Changes
Playful Graphic on Content Creation Strategies
Stylized Graph Showing Financial Growth with Dollar Coin
Colorful Infographic Representing KPI and Action Plan Concepts
3D Illustration of Location Tracking Feature
Investor Analyzing Data Trends on Laptop (Digital Visualization)
Comparison Infographic of Post Performance Metrics
Stylish Blue Background with Geometric Shapes and Icons
Stylized Financial Growth Chart with Dollar Coin
Colorful Informational Graphic on Marketing Concepts
Content Monetization Analytics Graphic
Abstract 3D Finance Illustration for Digital Business
3D Scene of Data Analysis and SEO in Vibrant Colors
3D Illustration of Amplitude's Product Analytics Features
Dynamic 3D Composition for Trade Analysis
Dynamic 3D Webpage Illustration with Features
3D Graph Depicting Decrease with Dramatic Background
3D Web Page Design Featuring Growth Metrics and Features
Modern Data Visualization Graphic with Bar Chart and Engaging Design
Financial Monitoring Graphic with Exchange Rate Visualization
Abstract Investment Concept Featuring Stock Market Growth Visualization
3D Design Illustration for Web Page Feature Blocks
3D Illustration on Content Marketing Strategy
Digital Transformation Business Growth Promotional Graphic
Dynamic Business Analytics Graphic with Economic Charts
3D Graphical Design for Business Growth Features
Vibrant analytics dashboard mockup
3D Illustration of Conversion Funnel Concept
Content Quality Improvement Graphic with Magnifying Glass
3D Graph and Chart Icons for Data Visualization
Financial Investment Analysis Graphic with Trend Chart
Modern Information Design for Data Usage Monitoring
3D Financial Design for Web Page Integration
Dynamic Stock Market Financial Charting Visual
Financial Insights Dashboard for Analysis
3D Scene of Data Analysis with Laptop and Graphs
Engaging 3D Illustration of Survey Participation
3D Illustration of Content Marketing Concept with Engaging Visuals
3D Visualization of Decrease Concept with Graph and Arrow
3D Illustration of Social Media Engagement Concept
3D Illustration of Statistics with Visual Features
Abstract Finance 3D Illustration for Digital Business Background
3D Conceptual Graphic on Search Engine Ranking
3D Web Design with Level Up Concept Illustration
3D Web Page Design with Integration Features
Vibrant Graphic Representing Technology and Business Trends
Investment Analysis Graphic with Growth Trends and Projections
Abstract Financial Growth Background with Chart Indicators
Data Visualization of Finance Crisis with Declining Trend
3D Visualization of SEO and Data Analysis Concepts
3D Illustration for Influencer Marketing Concept
Stylized Financial Growth Chart Graphic for Data Visualization
Dynamic 3D Wave Landscape for Data Science Visualization
3D Illustration of Know Your Customer Analyst with Modern Design
Ocean Waves Visualizing Market Trends and Analysis
Stylized Graph with Growth Arrow and Feature Box
3D Illustration for Forecasting Features on a Landing Page
Dynamic Big Data Technology Visualization Graphic
Traffic Analysis Infographic with Growth Metrics
3D Marketing and SEO Icons for Digital Strategy
3D Spectrum Analyzer with Real-Time Analysis Feature