Search
Sign In
Auto
2:3
Auto
2:3
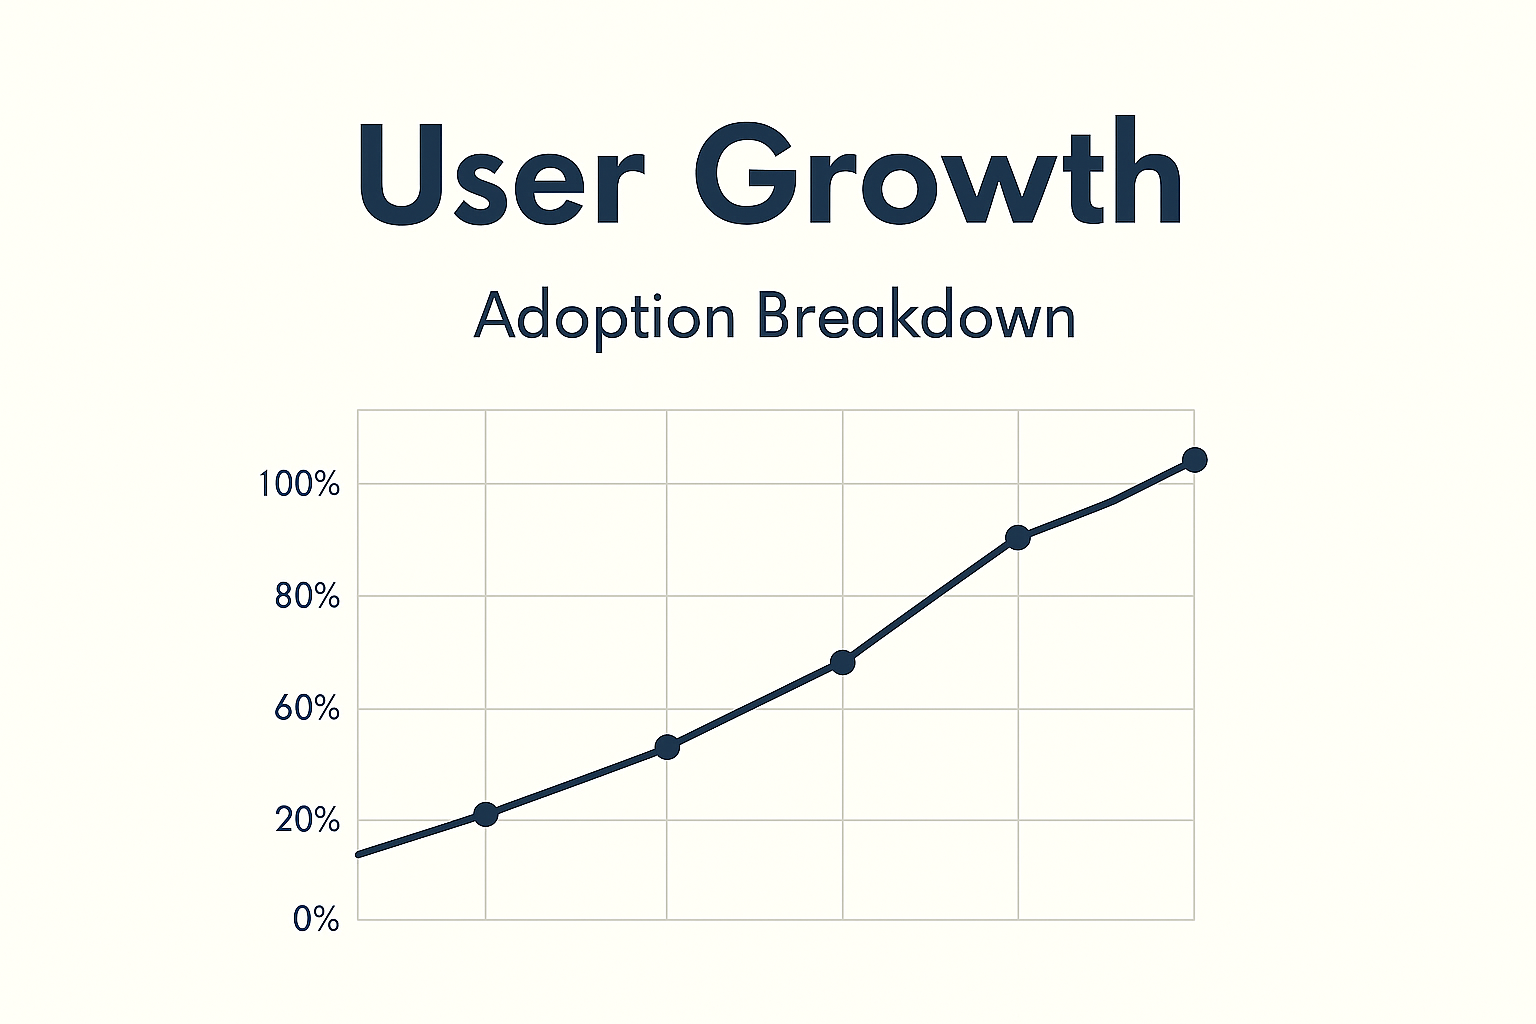
Graph Displaying User Growth and Adoption Trends
/
Free
/
Collection:
Base
/
by davooda
/
Type: PNG
/
Informative line graph illustrating user growth over time with clear percentage breakdowns, suitable for presentations or reports on adoption metrics.
Data Visualization of User and Revenue Growth Metrics
Stylized 3D Bar Graph Showing Growth Trend
User Demographics Bar Chart with Age Distribution
Conceptual Growth Illustration with Green Plant
Modern Digital Illustration for Project Launch Promotion
Graphical Representation of Customer Needs Growth
Dynamic Corporate Growth Graphics with Hand-Drawn Elements
Revenue Trend Graph Illustrating Audience Insights
Stylized Financial Growth Chart Graphic for Data Visualization
Modern Graph Icon Illustrating Growth and Progress
Graphical Representation of Performance Metrics with Bold Typography
Stylized Financial Growth Chart with Dollar Coin
Illustration of a Person Engaging with Analytics Growth on Mobile
Growth Chart with Rising Arrow Illustration
Infographic Highlighting Startup Ideas with Market Potential
Stylish Web Design for Business Growth
Professional Growth Achievement Graphic with Progress Bar
Illustrative Graphic on Growth Metrics and Financial Trends
Bold Red Arrow Design for Growth Concept
Infographic Featuring Grumpy Cat with Business Metrics
Positive Growth Indicator with Thumbs Up Symbol
Futuristic Landing Page Design with Vibrant Gradient Background
Stylized Graph Showing Financial Growth with Dollar Coin
Growth Chart Icons Representing Business Success
Illustration of Economic Growth with Increasing Graph
Miniature World of Growth in a 3D Scene
Performance Gauge Icon with Bold Typography
Business Strategy Infographic Highlighting Key Metrics and Actions
Modern Minimalist Landing Page Design with Neon Touch
Performance Gauge Graphic with Bold Typography
Healthcare Growth Chart with Medical Elements
Fluorescent Shadow Object with Chart Illustration
Business Funding Progress Chart with Growth Analysis
Dynamic Financial Chart with Rising Trends and Urban Background
Performance Meter Graphic with Bold Typography
Hand Placing Wooden Block on Pyramid Structure
Business Growth Concept with Upward Arrow and Bar Chart
3D Laptop with Rising Graph and Charts on Purple Background
Multilayer Landing Page Design with Modern Aesthetics
Minimalist Analytics Illustration with Graphs and Data
Performance Gauge Graphic with Indicator
User Feedback Illustration Featuring Negative Reviews
3D Bar Graph Representation of Conversion Rate Changes
Boho Style Landing Page Design with Footer
Minimalist 3D Scene of a Growing Plant on Dark Background
Performance Meter Graphic Indicating Efficiency Level
Modern Landing Page Design with Clear Typography and Action Buttons
3D Web Design Concept Featuring Growth Metrics
Modern Landing Page Design with Geometric Elements
Infographic on SEO Strategies with Action Plan Elements
Financial Growth Chart with Data Visualization
Performance Growth Chart with Positive Feedback Symbol
Illustration of Interlocking Gears in Different Sizes
Infographic Highlighting Key Performance Indicators (KPIs)
Investment Growth Performance Graphic with Bold Typography
Case Study Results Highlighting Key Metrics
Dynamic Landing Page Design with 3D Elements
Minimalist Landing Page Design with Geometric Elements
Modern Landing Page Design with Gradient Layers and Phone Mockup
Goal Tracking Illustration with Growth Metrics
Infographic Illustrating Action Steps for Project Management
Launch Your Business Promotional Graphic with Growth Chart
Illustration of a Workflow Process with Interactive Elements
Illustration of Interlocking Gears in Two Colors
Modern Landing Page Design for Business Growth
Minimalist Landing Page Design for Marketing Software
Market Growth Trends Visualization with Strategic Insights
Modern Presentation Slide with Data Visualization Elements
Dynamic Graphic Promoting Growth and Engagement
Illustrative Diagram of Customer Feedback Loop Process
Performance Gauge Illustration with Clear Indicators
Infographic Depicting Rocket Launch with Laptop Illustration
Illustrative Infographic of a Workflow Process
Performance Gauge Icon with Red and White Color Scheme
Stylized Graph with Growth Arrow and Feature Box
Modern Instagram Landing Page with Geometric Logo Design
Illustrative Graphic for Business Startup Theme
Inspirational Growth Concept with Seedling
Confident Business Presentation by a Professional Woman
Performance Indicator Graphic with Gauge and Thumbs Up
Simple Comparison Chart with Check and Cross Icons
3D Landing Page Design with Coupons and Features
Lock Symbol Representing Data Security and Flowing Information
Dynamic Landing Page Design with Grass Elements
Performance Meter Graphic with Thumbs Up Icon
Business Professional Analyzing Graphs and Charts
Business Startup Concept with Rocket Illustration
KPI Performance Metrics Graphic for Business Analysis
Stylish Web Design Concept Featuring Growth Theme
Hyperrealistic Red Arrow with Glowing Micro-LEDs and Neon Accents
Futuristic Rocket Launching from Laptop Screen
Digital Illustration of Startup Launch Concept with Rocket and Laptop
Flowchart Illustrating Workflow Process Steps
Infographic on Plastic Waste and Recycling Statistics
Stylized Representation of Population Segmentation
Dynamic Stock Market Graphic Illustrating Trends and Analysis
Modern Landing Page Design with Geometric Elements
Dynamic Landing Page with 3-Step Process Infographic
Performance Gauge Graphic Indicating Metrics
Futuristic Rocket Launching from a Laptop
Traffic Analysis Infographic with Growth Metrics
Data Visualization of Influencer Marketing Performance Over Time
Digital Transformation Growth Chart Graphic
Influencer Marketing Performance Graphic with Data Visualization
Informative Infographic on Mobile Usage Statistics
Live Concert Attendance Infographic with Statistics
Infographic on Influencer Marketing Performance Metrics
Concert Audience Analysis Infographic
Data Visualization for Influencer Marketing Performance
Illustration of Channel Analytics with Trend Graph
3D Presentation Visual with Key Features and Graphs
Modern Graphic Highlighting User Ratings with Bar Graph
Professional Data Presentation and Evaluation Graphic
Influencer Marketing Performance Data Visualization
Influencer Marketing Performance Analysis Graphic
Influencer Marketing Performance Analysis Graphic
Informative Graphic on Tracking Website Performance Metrics
Infographic Highlighting Case Study Results with Graphical Elements
Financial Investment Analysis Graphic with Trend Chart
Modern Data Analysis Graphic with Insights Theme
Influencer Marketing Performance Analysis Graphic
3D Illustration for Channel Growth Analytics
Data Visualization for Influencer Marketing Performance
Infographic on Pickleball Participation and Growth Statistics
Dynamic Data Visualization for Business Process Automation
Digital Data Exploration and Analytics Graphic
Modern Presentation Slide with Data Visualization
Modern Data Visualization Graphic with Bar Chart and Engaging Design
Content Monetization Analytics Graphic
Dynamic Presentation Scene with Engaging Visual Elements
Email Marketing Performance Infographic Highlighting Key Metrics
Promotional Graphic for Cloud Computing Adoption
Marketing Performance Dashboard Graphic
Digital Transformation Business Growth Promotional Graphic
Interactive Data Dashboard Promotional Graphic
Market Analysis Graphic with Data Visualization
Stylish Web Design for Data Organization
Data Analysis for Startups: Enhancing Sales and Profits
Alerting Users About Suspicious Account Activity
Employee Benefits Presentation Slide with Salary Trends Graph
Graphical Representation of Rating Improvement Strategies
Modern Data Transfer Infographic with Growth Metrics
Infographic on Social Media Usage by Age Group
E-commerce Trends Graphic with Data Visualization
Infographic on Software Development Metrics with Illustrative Style
Concert Attendance Data Infographic with Visual Statistics
Professional Data Analysis Presentation Graphic
3D Illustration of Website Traffic Concept with Growth Graph
Visual Representation of Charts and Data Overview
Modern Graphic for Enterprise Solutions with Customization Theme