Search
Sign In
Auto
2:3
Auto
2:3
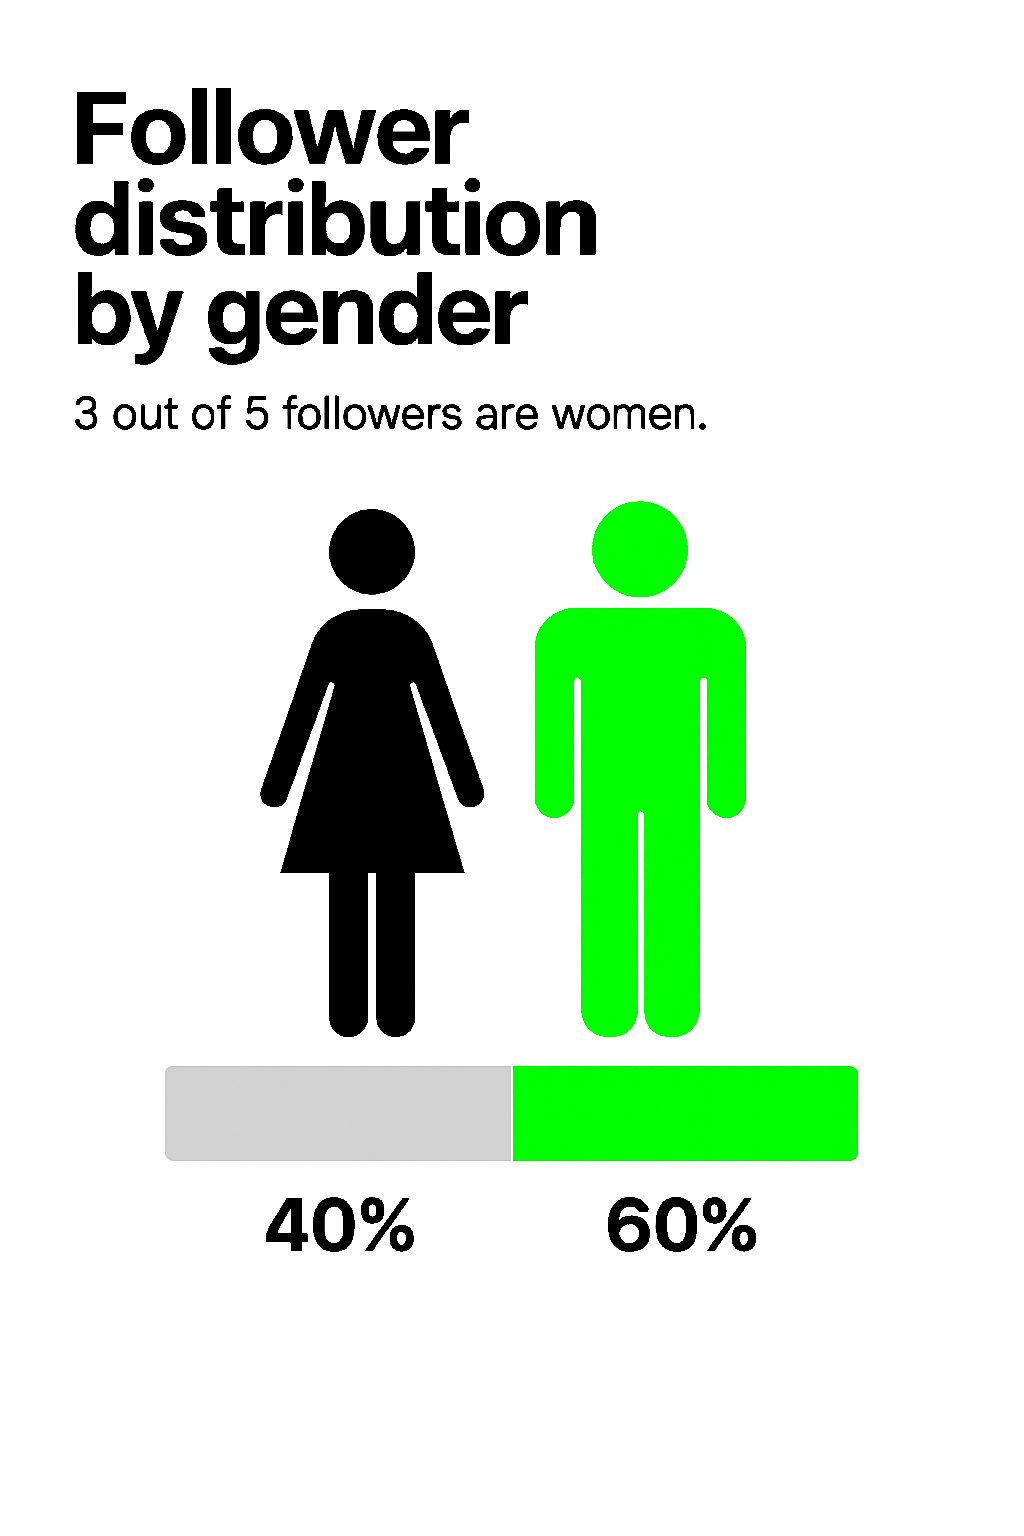
Infographic Representing Gender Follower Distribution
/
Free
/
Collection:
Basic Green
/
by davooda
/
Type: PNG
/
Simple infographic illustrating follower distribution by gender with clear visual representation, ideal for social media analysis and marketing insights.
User Demographics Bar Chart with Age Distribution
Illustrative Graphic Representing Social Media Followers Count
Infographic on Influencer Marketing Performance Metrics
Graphic Representation of Social Media Engagement
Stylized Representation of Population Segmentation
Social Media Follower Milestone Graphic
Illustrative Graphic Representing Social Media Follower Milestone
Infographic on Influencer Marketing Performance Metrics
Influencer Marketing Performance Graphic with Engaging Visuals
Influencer Marketing Performance Dashboard Illustration
Data Visualization for Influencer Marketing Performance
Social Media Engagement Graphic Highlighting Followers Concept
Infographic on Advertising Budget Distribution by Medium
Data Visualization of Influencer Marketing Performance Over Time
Digital Marketing Performance Graphic with Data Visualization
Infographic on Social Media Usage by Age Group
Influencer Marketing Performance Analysis Graphic
Illustrative Graphic of Audience Engagement on Mobile Device
Audience Demographics Pie Chart Illustration
Illustrative Graphic of Mobile App User Engagement
Influencer Marketing Performance Graphic with Data Visualization
Colorful Social Media Engagement Illustration with Abstract Figures
Influencer Marketing Performance Metrics Graphic
Influencer Marketing Performance Analysis Graphic
Promotional Graphic for Follower Giveaway Announcement
Influencer Marketing Performance Report Graphic
Target Audience Concept Illustration with Icons and Graphics
Audience Interests Infographic with Data Visualization
Performance Meter Graphic with Bold Typography
Data Visualization for Influencer Marketing Performance
Influencer Marketing Performance Data Visualization
Influencer Marketing Performance Analysis Graphic
Illustrative Graphic on Target Audiences with Demographic Insights
3D Web Page Design Featuring Activity Tracking Feature
Infographic on Audience Analysis for Influencer Engagement
Illustrative Social Media Promotion Graphic Featuring a Mobile Device
Illustration of User Interaction with Mobile App
Illustrative Graphic on Audience Engagement in Social Media
Engaging Social Media Promotion with Audience Growth Theme
Infographic on Audience Segmentation with Pie Chart
Performance Gauge Graphic with Bold Typography
International Women's Day Promotional Graphic Celebrating Empowerment
Graphical Representation of Performance Metrics with Bold Typography
Performance Gauge Icon with Bold Typography
Data Visualization of User and Revenue Growth Metrics
Performance Meter Graphic Indicating Efficiency Level
Illustrative Graphic on Target Audiences in Marketing
Illustrative Graphic for Influencer Marketing Concept
Performance Gauge Graphic with Indicator
Promotional Graphic for Social Media Giveaway
Email Marketing Performance Infographic Highlighting Key Metrics
Influencer Campaign Promotion Graphic with 3D Elements
Illustrative Graphic of a Young Woman Engaging with Smartphone
Mobile Notification Graphic for Social Media Engagement
Informative Graphic on Influencer Marketing Strategies
Minimalist Icon Graphic with Heart and Paper Plane
Illustration of a Person Engaging with Analytics Growth on Mobile
Illustrative Graphic for Instagram Story Engagement
Performance Metrics Infographic with Key Indicators
Modern Web Page Design for Follower Product
Illustrative Graphic on Influencer Marketing Analytics
Infographic Featuring Edo Period Demographics and Cultural Illustration
Performance Gauge Illustration with Clear Indicators
Digital Marketing Promotion with Engaging Visuals
International Women's Day Awareness Graphic with Illustrative Design
Digital Illustration of Travel Blogging Concept
Illustrative Graphic for Social Media Contest Announcement
Artistic Representation of Diversity with Silhouetted Figures
Performance Gauge Icon with Red and White Color Scheme
Performance Meter Graphic with Thumbs Up Icon
Celebratory Women's Day Graphic Featuring Diverse Female Silhouettes
Performance Gauge Icon with Minimalistic Design
International Women's Day Promotional Graphic with Watercolor Style
Illustrative Graphic on Influencer Marketing Concept
Infographic on the Impact of Social Media Influencers
Promotional Tag for Sponsored Content with Heart Design
Digital Interaction Illustration in a Cozy Café Setting
Illustration of Food Delivery Notification with Delivery Person
Playful Cat Illustration Featuring a Unique Pink Cat
Celebratory Illustration for International Women's Day with Empowerment Theme
Performance Indicator Graphic with Gauge and Thumbs Up
Infographic on Influencer Marketing Strategies
Illustrative Graphic on Influencer Marketing Concepts
Graphical Representation of Customer Needs Growth
Minimalist Analytics Illustration with Graphs and Data
Thank You Message Graphic for Video Content
Infographic Illustrating the Customer Journey Stages
Digital Illustration of Online Shopping Experience
Illustration of a Woman Engaging with Smartphone Notifications
Minimalist Illustration of Two Characters in Profile
Thank You Graphic with Bold Typography and Thumbs Up
Illustrative Graphic Representing Audience Segmentation
3D Giveaway Announcement Graphic with Interactive Elements
International Women's Day Celebration Graphic with Diverse Women
Celebratory Women's Day Graphic with Diverse Silhouettes
Social Media Engagement Promotional Graphic
Digital Marketing Concept with Audience Targeting Graphics
Informative Graphic on Influencer Marketing Concepts
Performance Meter Graphic Illustrating Measurement Concept
Performance Meter Graphic with Hand Interaction
Informative Graphic on Solar Panel Installation Growth
Informative Infographic on Plastic Waste Statistics
Engagement Strategy Social Media Graphic
Cosmetic Marketing Infographic on Lipstick Preferences
Infographic Highlighting Dog Ownership Statistics
Informative Infographic on Mobile Usage Statistics
Concert Audience Analysis Infographic
Infographic on Plastic Waste and Recycling Statistics
Live Concert Attendance Infographic with Statistics
Informative Pizza Consumption and Popularity Graphic
Minimalist Design Graphic Featuring Smooth Gradients
Visual Guide to the Infographic Design Process
Cosmetic Marketing Infographic Featuring Lipstick Trends
Email Automation Flowchart Infographic
Email Automation Flowchart with Clear Visuals
Children's Toy Survey Infographic with Cute Plush Toys
Informative Infographic on Campaign Performance Metrics
Yes vs No Fashion Choices: A Comparative Guide
Informative Graphic on Sustainable Energy Sources
Awareness Graphic on Car Accidents and Traffic Violations
Infographic Highlighting Case Study Results with Graphical Elements
Infographic on Global Plastic Waste Statistics and Impact
Creative Brand Redesign with Modern Elements
Informative Trading Strategy Graphic for Investors
Informative Infographic on Lightning and Electrical Energy
Infographic on Plastic Waste and Recycling Statistics
Collaboration Promotion Graphic for Creators
Modern Kitchen Design Concept Featuring Minimalist Aesthetic
Before and After Renovation: Transform Your Home
Stylish Living Room Decor Tips Graphic
Modern Graphic Design for Video Engagement Tips
Stylish Modern Farmhouse Kitchen Interior Design
Infographic on Pickleball Participation and Growth Statistics
Informative Graphic on Social Media Verification Process
Infographic on Influencer Marketing Campaigns
Visual Representation of Social Media Engagement Metrics
Infographic Highlighting Factory Worker Employment and Salary
Infographic Highlighting Global Pizza Market Trends
Informative Graphic on Influencer Marketing Strategies
Visual Representation of Charts and Data Overview
Fashion Portrait Featuring High Fashion Clothing and Stylish Look
Engaging Research Summary Graphic Highlighting Key Statistic
Informative Infographic on Traditional Italian Pizza
camo military pattern design
Nature-Themed Infographic on Sustainability and Biodiversity
Infographic on Employee Satisfaction and Productivity Benefits
Step-by-Step Illustrator Texture Creation Guide
Illustrative Graphic on Influencer Verification Benefits
Interactive Social Media Engagement Graphic
Elegant Modern Ceiling Light for Brightening Spaces