Search
Sign In
Auto
2:3
Auto
2:3
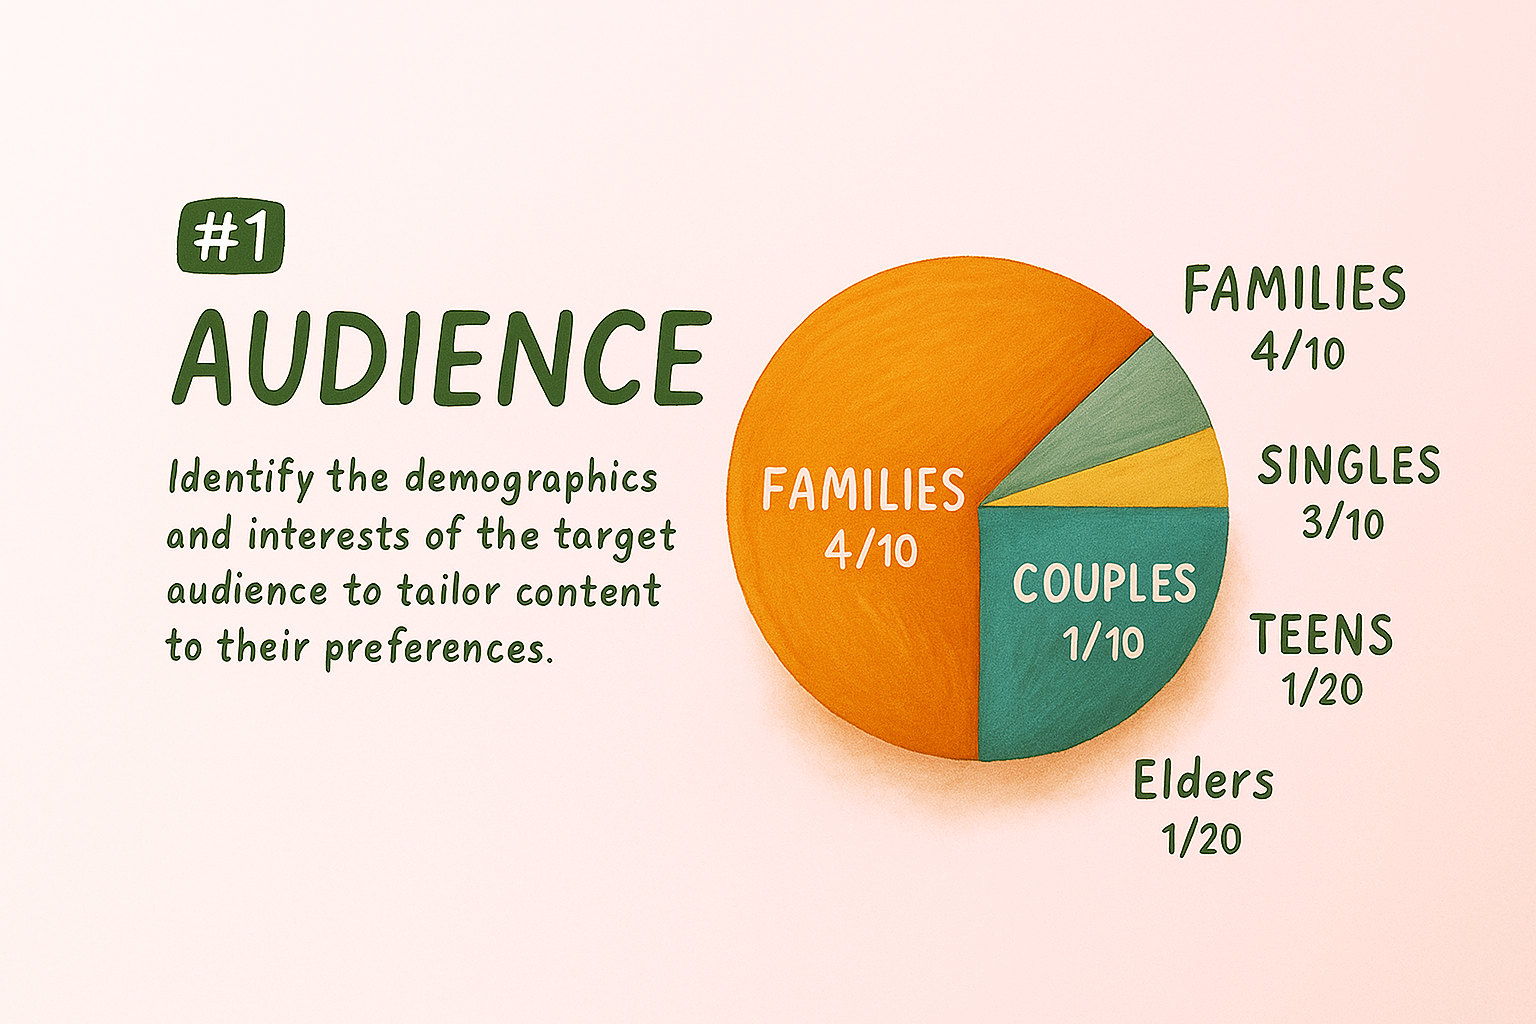
Audience Demographics Pie Chart Illustration
/
Free
/
Collection:
Let's Present
/
by davooda
/
Type: PNG
/
Informative infographic showcasing audience demographics through a colorful pie chart, ideal for educational or marketing presentations.
Infographic on Audience Analysis for Influencer Engagement
User Demographics Bar Chart with Age Distribution
Infographic on Audience Segmentation with Pie Chart
Audience Interests Infographic with Data Visualization
Illustrative Graphic on Target Audiences with Demographic Insights
Target Audience Concept Illustration with Icons and Graphics
Illustrative Graphic Representing Audience Segmentation
Infographic on Audience Targeting Strategies
Revenue Trend Graph Illustrating Audience Insights
Audience Targeting Graphic with Heart Motifs
Illustrative Graphic on Target Audiences in Marketing
Colorful Infographic on Influencer Marketing Strategies
Illustrative Graphic on Collaboration Between Content Creators
Illustrative Graphic of Audience Engagement on Mobile Device
Audience Targeting Concept with Hearts and a Bullseye
Illustration of Buyer Persona Concept for Marketing
3D Scene of Analytics Segment with Miniature Figures
Digital Marketing Concept with Audience Targeting Graphics
Infographic Representing Gender Follower Distribution
Vibrant Festival Audience Captivated by Performance
Illustrative Graphic Representing Target Audience Concept
Illustrative Graphic on Influencer Marketing Concepts
Stylized Representation of Population Segmentation
Informative Infographic on Business Strategies and Metrics
Infographic on Advertising Budget Distribution by Medium
3D Illustration of Educational Content on Computer Screen
Illustrative Marketing Concept with Hearts Representing Audience Targeting
Illustrative Graphic on Audience Engagement in Social Media
Informative Graphic on Key Performance Indicators (KPIs)
Close-up of a Dart Hitting a Colorful Target Board
Target Marketing Concept Featuring Dartboard and Arrow
3D Illustration of a YouTuber Creating Content
Informative Graphic on Audience Interests and Engagement
Audience Targeting Concept Graphic with Vibrant Design Elements
Infographic on Influencer Marketing Performance Metrics
Illustrative Graphic for Content Segmentation Strategy
Infographic on Influencer Marketing Strategies
3D Illustration of Social Media Targeting Concept
Playful Graphic on Content Creation Strategies
Illustrative Guide for Subscription Steps with Playful Design
Graphic Representation of Social Media Engagement
Bullseye Target with Arrow Hitting Center at Sunset
3D Infographic on Conversion Rate Calculation
Close-up of a Dartboard with an Arrow Hitting the Center
Graphical Representation of Customer Needs Growth
Colorful Infographic Representing KPI and Action Plan Concepts
Informative Graphic on Marketing Strategies and KPIs
3D Illustration for Influencer Marketing Concept
Colorful Social Media Engagement Illustration with Abstract Figures
Modern Geometric Landing Page Design with Call to Action
Dynamic Business Meeting with Team Collaboration and Strategy Planning
Illustrative Graphic on Audience Collaboration for Content Creators
3D Illustration on Content Marketing Strategy
Data Visualization for Influencer Marketing Performance
Informational Graphic on Web Metrics and Strategies
Informative Pizza Consumption and Popularity Graphic
Engaging Digital Marketing Infographic on Call to Action Strategies
Colorful Infographic Design Illustrating Data Visualization Concepts
Playful Character Illustration with Data Visualization Elements
Illustration of User Interaction with Mobile App
Informative Graphic on Business Strategies and Metrics
Dynamic Landing Page Design with Engaging Elements
Three Steps to Market Strategy Visual Guide
Dynamic Marketing Message with Megaphone on Orange Background
Data Visualization of Influencer Marketing Performance Over Time
E-commerce Marketing Infographic with Key Concepts
Concert Audience Analysis Infographic
Infographic Illustrating the Customer Journey Stages
Infographic on Key Business Strategies and Metrics
Infographic on Competitive Advantages in Business Strategy
YouTube Analytics Visualization for Performance Tracking
Illustration Depicting Collaborative Communication
Infographic on Influencer Marketing Campaigns
Infographic on Influencer Marketing Performance Metrics
Informative Graphic on Marketing Strategies and KPIs
Minimalist Illustration of Two Characters in Profile
Educational Infographic on Infographic Anatomy
Creative Graphic on Hashtag Content Strategy
Sales Funnel Infographic Illustrating Customer Journey
Holiday Insights Infographic with Statistics and Visual Elements
Educational Content Creation Graphic for Digital Learning
3D Illustration for Engaging Web Page Design Featuring Influencer
Performance Gauge Graphic with Bold Typography
Illustrative Graphic Representing Social Media Followers Count
Botanical Illustration with Informative Elements
Data Visualization for Influencer Marketing Performance
Engaging Social Media Promotion with Audience Growth Theme
Minimalist Landing Page Design with Engaging Elements
Infographic on the Impact of Social Media Influencers
Colorful Informational Graphic on Marketing Concepts
Social Media Follower Milestone Graphic
Digital Marketing Performance Graphic with Data Visualization
Informative Graphic on Digital Marketing Strategies
Informative Graphic on Marketing Strategies and KPIs
Infographic Illustration of the AIDA Marketing Funnel
Handshake Icon Representing Agreement and Friendship
Colorful Infographic on Marketing Concepts and Strategies
Influencer Marketing Performance Dashboard Illustration
Influencer Marketing Performance Analysis Graphic
Influencer Marketing Performance Graphic with Data Visualization
Colorful Infographic Design with Data Visualization Elements
Colorful Puzzle Pieces for Creative Problem Solving
3D Graph Analysis Illustration with Insights
Professional Data Analysis Presentation Graphic
Performance Meter Graphic Illustrating Measurement Concept
3D Illustration of Target Persona Concept for Marketing Strategies
Lead Generation Concept Graphic with Funnel and Audience Icons
Market Research Presentation Graphic with Trend Analysis
Conference Attendance Infographic with Key Statistics
Performance Meter Graphic Indicating High Performance Level
Business Growth Promotion Graphic with Chart Elements
Colorful Tag Icon Illustrating Categorization Concept
Vibrant Diversity Concept Featuring Multicultural Group
Colorful Puzzle Pieces for Engaging Activities
Vibrant Illustration of Inclusion and Diversity with Diverse Crowd
Infographic on Alternative Energy Sources and Efficiency
Customer Satisfaction Infographic with Diverse Employee Representation
3D Floor Plan Illustration for Real Estate Features
Educational Microbiology Graphic Featuring Microbes and Viruses
Educational Graphic on Microbes Featuring Viruses and Bacteria
Infographic on Marketing Strategies with Visual Icons
Colorful Representation of Diverse Cultural Community
Illustrative Graphic on Diversity and Inclusion Themes
Festive Christmas Wreath Graphic for Holiday Promotions
3D Illustration of Conversion Funnel Concept
3D Illustration of Aviation Basics with Colorful Airplane
Vibrant Academic Achievement Graphic with Report Card
Business Performance Infographic with Graph and Happy Icon
Sustainable Energy Infographic Promoting Renewable Technologies
Colorful Treasure Chest Graphic for Engagement
Colorful Puzzle Pieces for Creative Idea Development
Awareness Graphic on Dementia and Memory Decline
Infographic Elements Representing Marketing Metrics and Strategies
Performance Meter Graphic Indicating Efficiency Level
3D Web Design Illustration Featuring Comprehensive Reporting
Infographic Highlighting Business Statistics with Rocket Theme
Customer Satisfaction Gauge Graphic with Engaging Design
Professional Data Presentation and Evaluation Graphic
Informative KPI Graphic for Business Metrics
Informative Graphic on Christmas Candle Statistics
Engaging Team Building Concept Graphic
Diversity and Inclusion Awareness Graphic
Dental Health Infographic with Simple Illustrations
Engaging Table Tennis Illustration with Informative Design Elements
Illustrative Solar System Planets Concept with Educational Theme
Culinary Guide for Cooking Roasted Turkey
3D Movie Design with Clapperboard and Popcorn
Graduation Celebration Graphic Featuring Diploma and Cap
Illustrative Infographic on Key Performance Indicators (KPI)
Gaming Live Stream Announcement Graphic