Search
Sign In
Auto
2:3
Auto
2:3
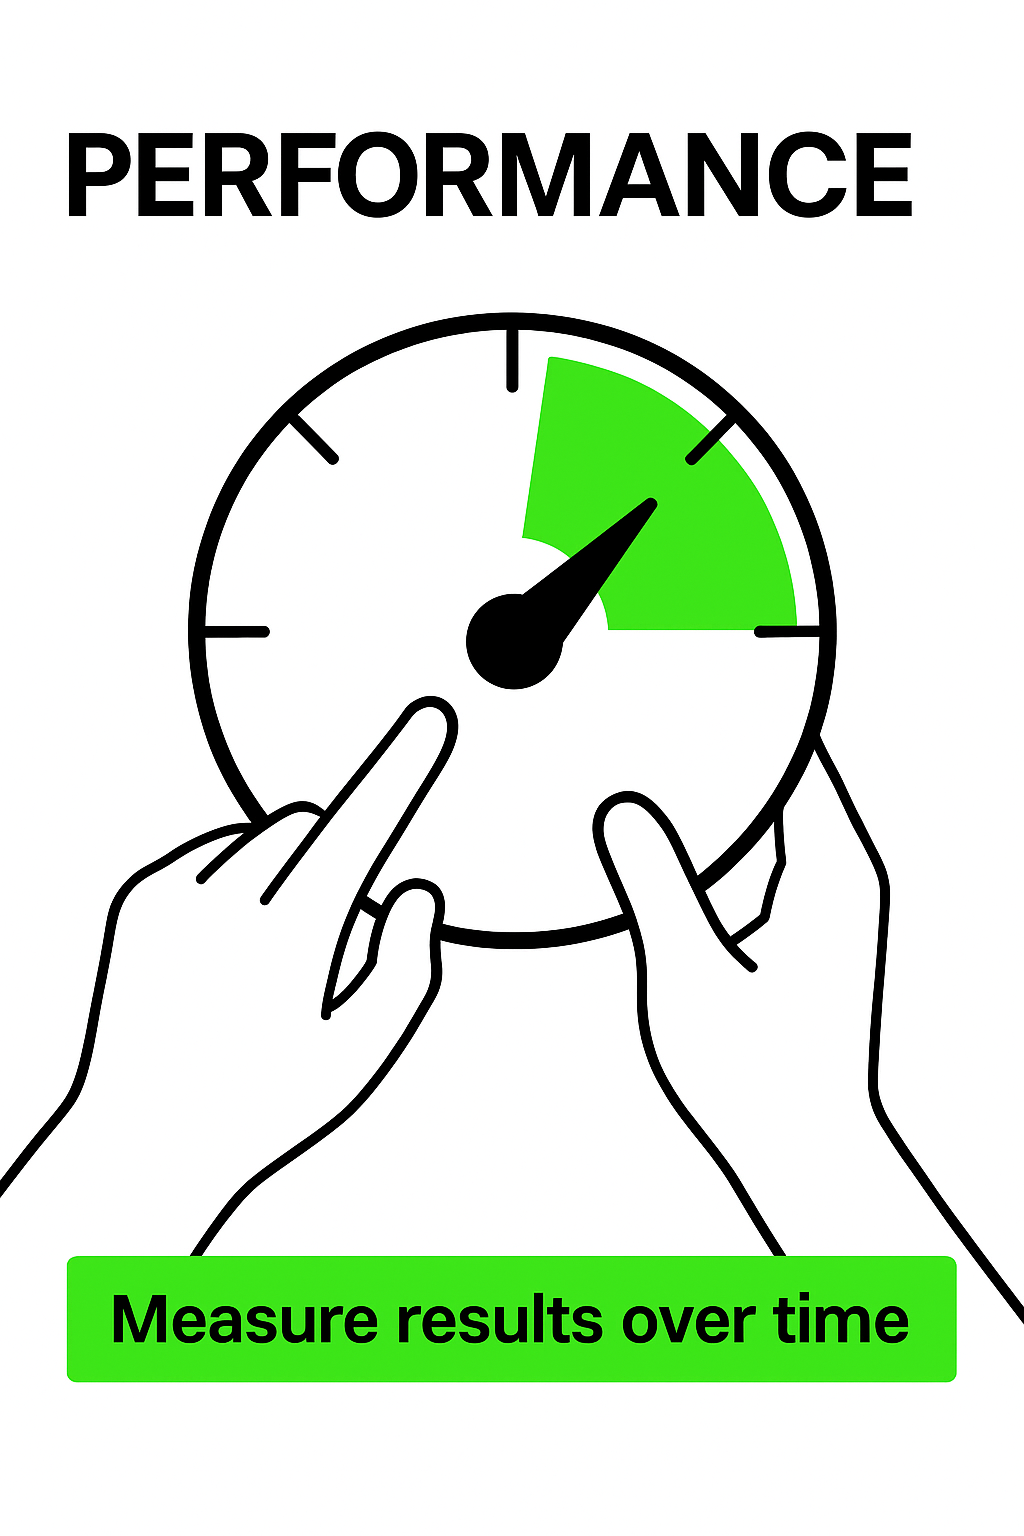
Performance Measurement Graphic with Gauge Illustration
/
Free
/
Collection:
Basic Green
/
by davooda
/
Type: PNG
/
Minimalist graphic depicting a gauge with hands indicating performance levels, ideal for presentations or reports focused on performance metrics.
Performance Meter Graphic Illustrating Measurement Concept
Performance Meter Graphic with Thumbs Up Icon
Performance Indicator Graphic with Hand and Gauge
Performance Meter Graphic with Hand Interaction
Performance Gauge Graphic with Engaging Visual Elements
Performance Gauge Graphic with Hand Interaction
Performance Indicator Graphic with Gauge and Thumbs Up
Performance Meter Graphic Indicating Efficiency Level
Performance Gauge Graphic with Bold Typography
Performance Meter Graphic with Bold Typography
Performance Gauge Icon with Red and White Color Scheme
Performance Gauge Graphic with Indicator
Performance Gauge Icon with Bold Typography
Performance Gauge Graphic with Bold Typography
Performance Gauge Illustration with Clear Indicators
Informative Graphic on Key Performance Indicators
Business Performance Infographic with Graph and Happy Icon
Performance Growth Chart with Positive Feedback Symbol
Performance Gauge Icon with Minimalistic Design
Graphical Representation of Performance Metrics with Bold Typography
Performance Gauge Graphic Indicating Metrics
Business Strategy Infographic Highlighting Key Metrics and Actions
Performance Rating Graphic with Star Metrics
KPI Comparison Graphic with Smartphone Illustrations
Performance Indicator Graphic with Positive Feedback
Performance Meter Graphic Indicating High Performance Level
Performance Growth Chart with Positive Feedback
Performance Metrics Infographic with Key Indicators
3D Web Design Illustration Focusing on Performance Metrics
Performance Indicator Graphic with Positive Feedback
Business Professional Analyzing Graphs and Charts
Positive Growth Indicator with Thumbs Up Symbol
Simple Project Timeline Infographic Design
Visual Representation of Feedback Mechanism with Hand and Thumbs Icons
Informative Graphic on Key Performance Indicators (KPIs)
Influencer Marketing Performance Report Graphic
Illustrative Infographic on Key Performance Indicators (KPI)
Minimalist Analytics Illustration with Graphs and Data
User Feedback Request Graphic with Star Rating System
Data Visualization of User and Revenue Growth Metrics
Stylized 3D Bar Graph Showing Growth Trend
Colorful Infographic Illustrating Business Performance Metrics
Digital Health Monitoring Illustration with Heart Rate Tracking
Infographic Highlighting Key Performance Indicators (KPIs)
Graphical Representation of Customer Needs Growth
Digital Illustration of a Credit Score Display on a Mobile Device
Illustration of a Person Engaging with Analytics Growth on Mobile
Informative Graphic on Marketing Strategies and KPIs
Bullseye Target with Arrow Hitting Center at Sunset
Stylized Financial Growth Chart with Dollar Coin
Dynamic Business Meeting with Team Collaboration and Strategy Planning
Infographic Displaying KPI Progress Metrics with Visual Elements
Illustration of Interlocking Gears in Two Colors
Informative KPI Graphic for Business Metrics
Illustration of a High Credit Score on a Smartphone
Document Checkmark Icon for Approval
Minimalist E-commerce Illustration with Shopping Cart
Infographic Design Highlighting Efficiency Metrics
Influencer Marketing Performance Dashboard Illustration
Informative Graphic on KPI Metrics for Performance Evaluation
Close-up of a Dart Hitting a Colorful Target Board
Informative Graphic on Key Performance Indicators (KPIs)
Illustrative Diagram of Customer Feedback Loop Process
Illustration of Interlocking Gears in Different Sizes
Row of Network Servers with Glowing LED Lights
Influencer Marketing Performance Analysis Graphic
Informative Graphic on Key Performance Indicators and Action Plans
Infographic on Influencer Marketing Performance Metrics
Illustration of a Hand Holding a Phone with a Play Button
KPI Infographic with Performance Metrics and Graphs
Infographic Highlighting Case Study Results with Graphical Elements
Influencer Marketing Performance Analysis Graphic
Illustrative Graphic on Growth Metrics and Financial Trends
Dynamic Mental Growth Illustration for Business Performance
Digital Noise Level Monitoring Illustration
Infographic on Influencer Marketing Performance Metrics
Infographic on Key Business Strategies and Metrics
Simple Comparison Chart with Check and Cross Icons
Colorful Infographic Representing KPI and Action Plan Concepts
Illustration of a Workflow Process with Interactive Elements
Colorful Infographic on Marketing Concepts and Strategies
Digital Marketing Performance Graphic with Data Visualization
Promotional Graphic Highlighting Customer Service Features
Influencer Marketing Performance Graphic with Data Visualization
Close-up of a Dartboard with an Arrow Hitting the Center
Thank You Graphic with Bold Typography and Thumbs Up
Customer Feedback Request Graphic with Rating Stars
Feedback Request Graphic Featuring Emoji Ratings
Illustrative Guide to Measuring Noise Levels with Smartphone
Illustration of Air Quality Monitoring and Purification
Illustration of Economic Growth with Increasing Graph
Social Media Post KPI Comparison Graphic
Case Study Results Highlighting Key Metrics
Fitness Tracker Illustration Displaying Step Goals
Informative Graphic on Marketing Strategies and KPIs
Case Study Results Visual with Graphs and Statistics
Infographic on SEO Strategies with Action Plan Elements
Growth Chart Icons Representing Business Success
Growth Chart with Rising Arrow Illustration
Stylized Graphic Representing Key Performance Indicators
Customer Satisfaction Promotion Graphic with Gauge Visualization
Customer Satisfaction Gauge Graphic with Engaging Design
Customer Satisfaction Feedback Graphic with Gauge and Smiley Face
Customer Satisfaction Enhancement Graphic with Gauge Design
Customer Satisfaction Gauge Graphic for Business Promotion
Customer Satisfaction Improvement Graphic with Rating Meter
Customer Satisfaction Indicator Graphic with Smiley Face
Customer Satisfaction Enhancement Graphic
Pressure Gauge Promotional Graphic for Monitoring Solutions
Illustration of Digital Credit Score Assessment
Stylish Tachometer Illustration for Web Design
Automotive Performance Promotional Graphic with Speedometer
Professional Growth Achievement Graphic with Progress Bar
Promotional Graphic for Pressure Gauges with Clear Readability
Stylish Minimalist Interface for Time Management
Customer Feedback Request Graphic with Star Ratings
Stylish Tachometer Design for Web Interface
3D Illustration of Pressure Gauge with Definition
Business Performance Analysis Graphic with Trend Chart
Customer Satisfaction Concept with Thumbs Up and Stars
Heart Rate Monitoring Graphic for Fitness Tracking
Informative Graphic on Tracking Website Performance Metrics
3D Tachometer with High-Performance Display Feature
Stylish Minimalist Web Interface Featuring a Stopwatch
3 Minute Timer Graphic with Stopwatch Concept
3D Tachometer with High Accuracy Feature Display
Stylish Barometer Illustration for Weather Forecasting
Fitness Tracker Interface Illustration with Step Count
Data Analytics Illustration with Graphs and Percentages
Implementation Timeline Graphic with Progress Indicators
Engaging Feedback Request Graphic with Hand and Thumbs Up Symbol
Stylish Web Design with Stopwatch Timer for Task Management
3D Illustration of Speed Up Indicators with Dynamic Design Elements
Lead Targeting Concept Graphic with Magnifying Glass
KPI Infographic for Data Visualization and Analysis
Financial Dashboard Visualization with Data Insights
Professional Employee Performance Review Meeting Graphic
Motivational Graphic for Goal Tracking and Progress Monitoring
Professional Data Presentation and Evaluation Graphic
Market Analysis Graphic with Data Visualization
Target Marketing Concept Featuring Dartboard and Arrow
Automotive Maintenance Graphic Featuring Car Engine Repair
Content Quality Improvement Graphic with Magnifying Glass
Graphical Representation of Rating Improvement Strategies
Market Research Presentation Graphic with Trend Analysis
Health Monitoring Graphic with Mobile Device and Blood Pressure Measurement
Customer Satisfaction Infographic with Diverse Employee Representation
Customer Satisfaction Promotion Graphic with Engaging Metrics
Task Management Illustration for Productivity
Investment Concept Graphic Featuring Hourglass and Growth Chart