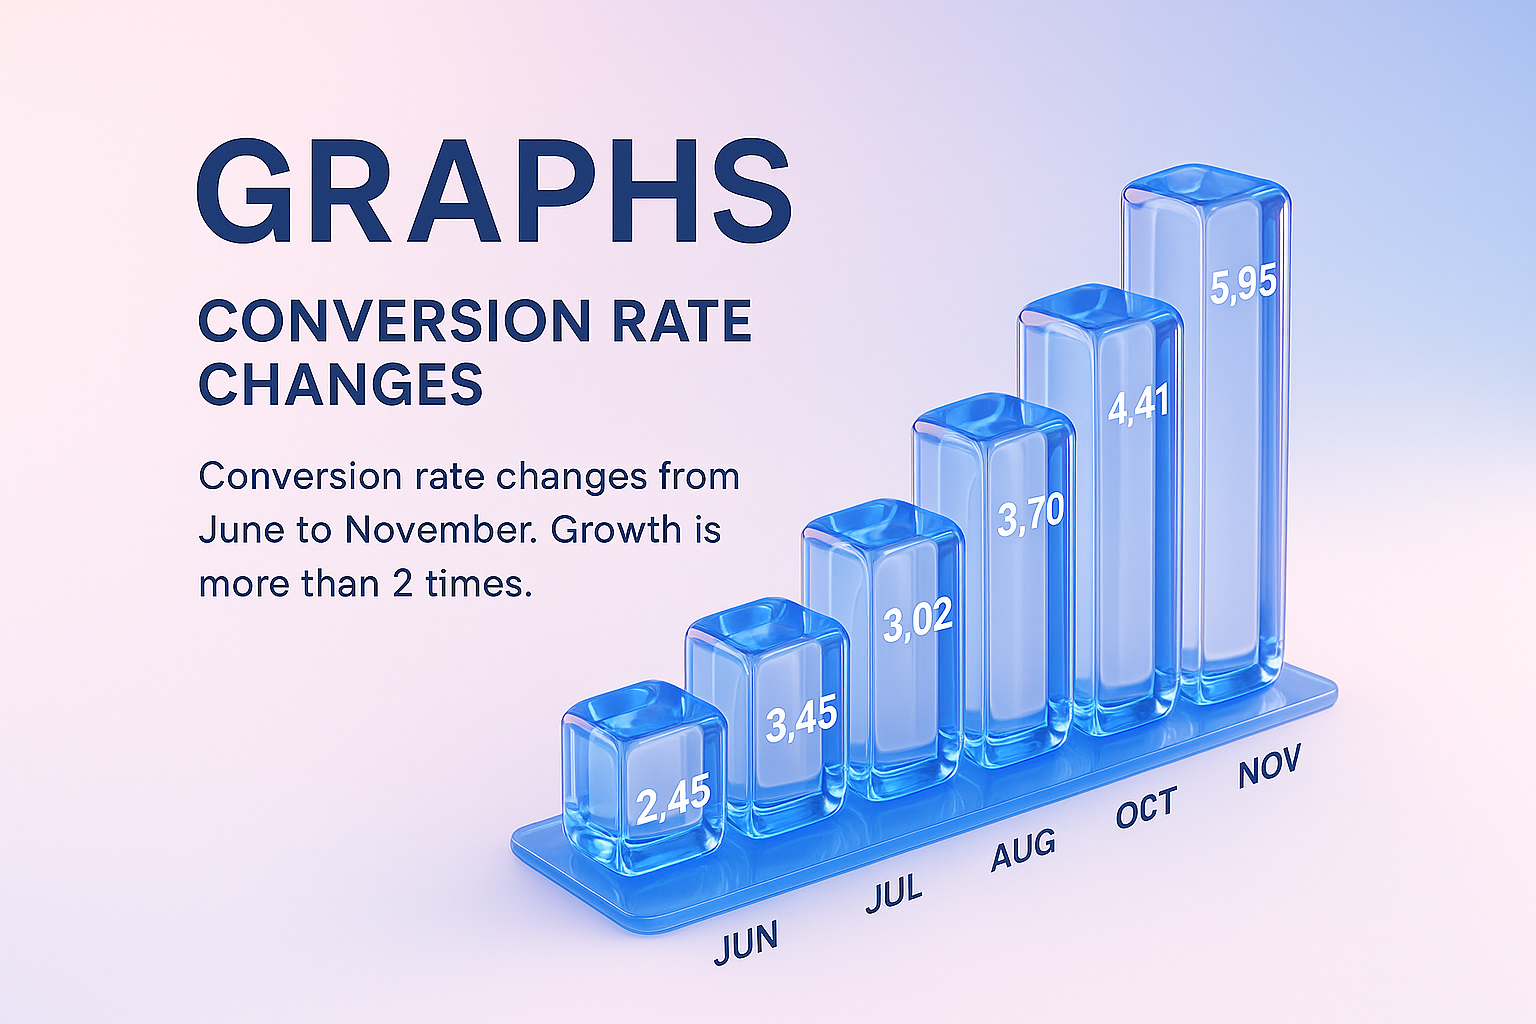
3D Bar Graph Representing Conversion Rate Changes Over Time
/Free/Collection: /by davooda/Type: PNG/A modern 3D bar graph showcasing conversion rate changes from June to November. The design features a gradient background and clear data visualization, ideal for business presentations.