
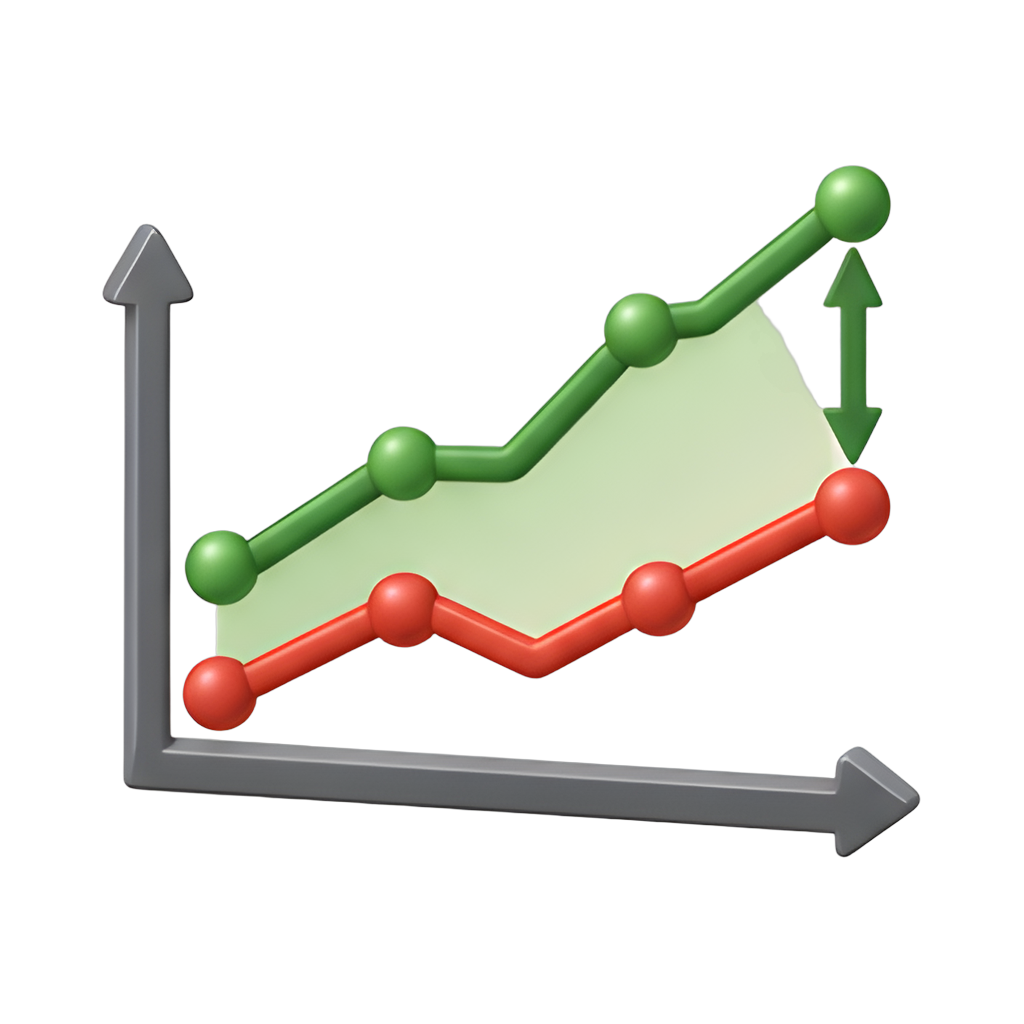
Revenue and cost analysis chart
This image features a clear revenue and cost line chart with a shaded area representing the profit gap.This image features a clear revenue and cost line chart with a shaded area representing the profit gap. Ideal for financial presentations, business reports, or social media posts related to financial insights.
PNGAI-generatedFree
 3D Icons→


