Search
Sign In
2:3
2:3
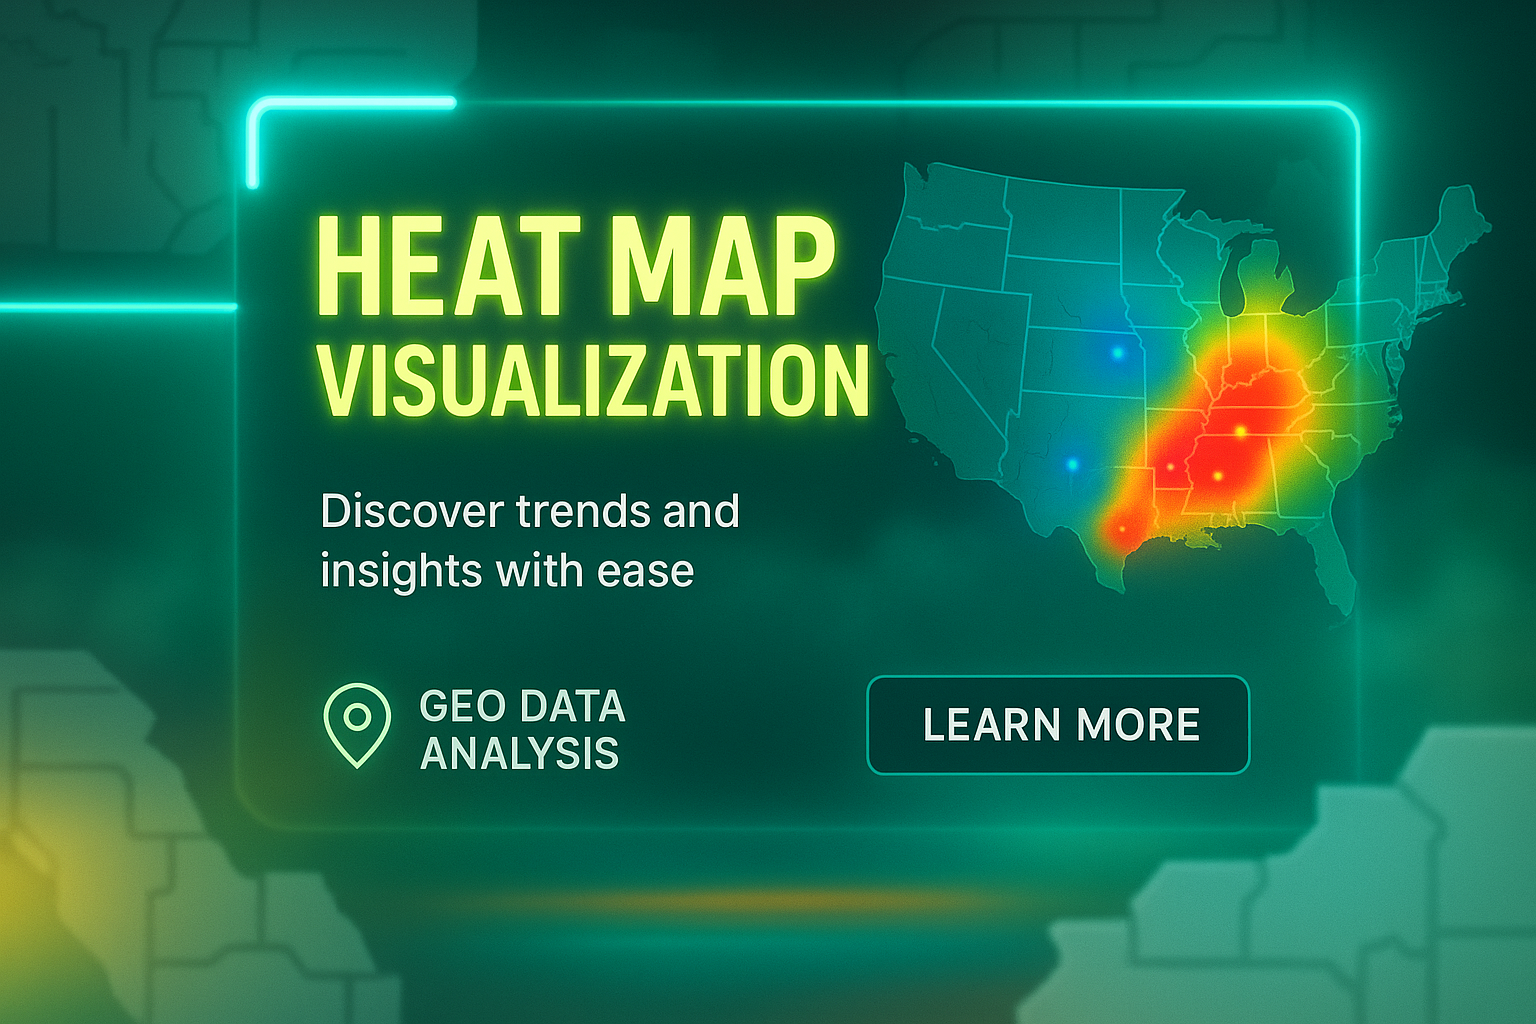
Interactive Heat Map Visualization for Geo Data Insights
/
Collection:
Base
/
by davooda
/
Type: PNG
/
Modern digital graphic showcasing a heat map visualization of geo data, designed to highlight trends and insights. Ideal for data analysis presentations.
Interactive Heat Map Visualization Tool for Geographic Data Insights
Interactive Heat Map Visualization Interface for Data Analysis
Colorful Machine Learning Heatmap Illustrating Learning Process
Detailed 3D Illustration of Data Visualization
Detailed 3D Map Scene in Realistic Style
Interactive Data Dashboard Promotional Graphic
Detailed 3D Map with Interactive Features
Realistic 3D Map Scene with Interactive Elements
Promotional Graphic for Excel Data Analysis Tool
Detailed 3D Graph Illustration with Action Button and Text
Realistic 3D Map Scene with Location Pin and Text Elements
Detailed 3D Graph Illustration with Text Elements
Financial Dashboard Visualization with Data Insights
Miniature Real World: Detailed 3D Data Analysis Scene
Infographic on Statistics and Data Analysis in Neon Design
Detailed 3D Graph Illustration for Data Analysis
Statistics and Data Analysis Infographic with Neon Elements
3D Illustration of Weather Forecasting Features
Interactive World Map Exploration Graphic
3D Illustration for Data Analysis Landing Page
3D Visualization of SEO Data Analysis and Optimization Techniques
3D Weather Scene with Elements of Sunshine, Clouds, and Lightning
Dynamic Forecast Design for Weather Applications
3D Scene of Data Analysis with Laptop and Graphs
Dynamic Machine Learning Heatmap Visualization
Detailed 3D Map with Environmental Features and Interactive Elements
Dynamic Real-Time Analytics Dashboard Graphic
Investor Analyzing Data Trends on Laptop (Digital Visualization)
Detailed 3D Scene Depicting Data Analysis Process
Interactive World Map for Exploration and Discovery
3D Illustration of a Satellite Map with Features
Realistic 3D Weather Scene with Nature Elements
Detailed 3D Map Scene with Magnifying Glass
Dynamic Financial Dashboard Graphic with Data Visualization
User-Friendly Navigation App with Key Features
Landing Page Design Featuring 3D Illustration for Lepton Tool
Modern Information Design: Data Usage Visualization
Ocean of Price Charts in a 3D Illustration
3D Graph Analysis Illustration with Insights
Professional Black Woman Working on Laptop in Modern Office
Promotional Graphic for Excel Data Analysis Tools
3D Weather Report Illustration with Features Overview
3D Market Analysis Visualization with Graphs and Arrows
Data Analytics Promotional Graphic with Modern Design
Interactive Financial Data Dashboard Promotion
3D Visualization of SEO and Data Analysis Concepts
3D Abstract Halftone Map of Latvia in Flag Colors
3D Illustration for Forecasting Features on a Landing Page
Smartphone Navigation with City Map Illustration
3D Scene of Data Analysis and SEO in Vibrant Colors
Modern Trendy Charts Promotional Graphic
High-Quality Interactive World Map with Vibrant Colors
Stylized Candlestick Chart Illustration for Financial Data
3D Map of Transport Opportunities with Key Features
3D Landing Page Design with Analytics Features
Bright Weather Forecast Graphic with Cloud and Sun Motif
3D Weather Report Illustration with Features Highlights
Comprehensive Weather Report Landing Page Design
Engaging Weather Report Landing Page Design
Interactive Map Feature with 3D Design for Location Identification
3D Weather Scene Illustration with Realistic Elements
Data Analysis Promotional Graphic with Magnifying Glass
Temperature Monitoring Concept with Visual Elements
Modern Business Visualization Graphic with Process Options
Interactive Icon Set Featuring Location Tracking Design
Engaging Video Promotion Graphic with Modern Design
Stylized 3D Map Representation of Latvia with Bold Colors
Stylish Infrared Web Design Concept with Realism Focus
Modern Web Page Design for Threat Detection Alerts
Excel Data Analysis Promotion with Magnifying Glass
Ocean Waves Visualizing Market Trends and Analysis
Detailed 3D Weather Scene with Realistic Elements
3D Visualization of Location Tracking Features
Find Your Destination - Intuitive Location Features
3D Weather Scene with House and Storm Elements
3D Visual Structure with Location Pin and Text Overlay
Modern Data Analysis Graphic with Insights Theme
3D Abstract Halftone Map of Latvia with Modern Design
Dynamic Stock Market Financial Charting Visual
Explore Global Destinations with a World Map
Infrared Technology Landing Page Design with 3D Elements
3D Illustration of Location Tracking Feature
3D Icons for Location Tracking and Communication Features
Futuristic Conference Room with Advanced Technology
Dynamic Font for Automotive Logos in Vibrant 3D Design
Dynamic Data Presentation and Evaluation Illustration
3D Laboratory Design with Analysis Features
3D Icon Set for Geolocation Services in Web Design
Market Research Presentation Graphic with Trend Analysis
Illuminated Silhouette World Map with Call to Action
Infrared Technology: Imaging and Sensing Features Explained
Stylish Web Design Concept for Security Alerts
Stylized Storm Weather Graphic with Bold Design
Mobile Phone with City Map Highlighting Location
Promotional Graphic for Traveling in Romania with Map Design
Colorful Weather Report Graphic with Icons
3D Web Design Illustration Featuring Search Functionality
3D Weather Report Illustration with Gradient Background
Stylish Infrared Web Design with Vibrant Tree Illustration
Engaging Promotional Graphic for Temperature Solutions Services
Financial Insights Dashboard for Analysis
Digital Data Exploration and Analytics Graphic
3D Visualization of Location Features for Web Design
Modern Big Data Technology Promotional Graphic
Modern Data Visualization Graphic with Bar Chart and Engaging Design
Modern digital feature highlight with data insights
3D Illustration of Amplitude's Product Analytics Features
Stylish Web Page Design Featuring Clear Data Visualization
World Map with Geographic Information and Exploration Theme
KPI Infographic for Data Visualization and Analysis
Dynamic Data Visualization for Business Process Automation
Dynamic Stock Market Expansion Visualization with Financial Data
Dynamic Business Analytics Graphic with Economic Charts
3D Illustration of Location Tracking Web Page Design
3D Illustration of Location Tracking Feature for Web Design
Digital Financial Chart Representing Market Growth
Modern Dynamic Design Landing Page with 3D Map and Vibrant Accents
Cinematic Data Display on Laptop with Analytics
Market Growth Trends Visualization with Strategic Insights
Globalization Manager Interface Design Concept with Informative Overlay
Futuristic Technology Graphic Showcasing AI and Data Flow
3D Illustration of a Hurricane with Informative Overlay
Promotional Graphic for Data Exploration Theme
Conceptual Graphic on Facial Recognition Technology
Market Analysis Graphic with Data Visualization
Futuristic Technology Graphic with Digital Elements
Dynamic Data Visualization for Business Process Automation
Innovative Navigation Feature with 3D Map Design
Modern Weather Update Graphic with Interactive Elements
Futuristic Technology Exploration Visual with Interactive Display
Futuristic Technology Promotion Graphic with Interactive Elements
Modern Tech Infographic on Global Connectivity
Content Monetization Analytics Graphic
3D Illustration of Radar Technology with Interactive Elements